muh gap! [FAIR VALUE GAP FINDER]Change the colors of the indicator to contrast your chart! Make sure to also change the transparency for the colors.
---
This indicator finds fair value gaps which are inefficiencies in price delivery. Gaps can be used for entry or even bias.
I've included midpoints, lines, and boxes. Boxes have the greatest range with respect to historic PA so keep that in mind.
I will be updating this script in the future, potentially adding an MTF function, mitigation of gaps and alarms.
Let me know if you guys have any additional ideas.
Best,
P
Wyszukaj w skryptach "fair value gap"

ICT Fair Value Gaps [Zero-Noise Edition]ICT Fair Value Gaps
Overview
In the Smart Money Concepts (SMC) framework, clarity is the ultimate edge. Most FVG indicators clutter your screen with "ghost boxes" that remain long after they have been filled. This professional-grade tool identifies high-displacement institutional imbalances and automatically dissolves them the moment they are mitigated.
Key Features
Precision Detection : Uses the classic 3-candle displacement logic to identify institutional gaps.
Auto-Mitigation : Boxes are removed the moment price retraces and "fills" the imbalance, keeping your chart 100% clean.
High Performance : Optimized with array-based logic for zero-lag performance on all timeframes.
Built-in Alerts : Stay informed with real-time notifications when new institutional displacement occurs.
How to Trade This Tool
The Trigger : A new FVG box appears, confirming institutional "intent."
The Draw : Treat the open boxes as magnets for price (Draw on Liquidity).
The Entry : Wait for price to retrace and tap the edge of the "open" FVG.
The Exit : Use opposing mitigated zones or swing points for targets.
Customizable Settings
Visuals : Custom color palettes for Bullish and Bearish imbalances.
Labels : Toggle "FVG" text on or off for a minimalist HUD experience.
Logic : Option to hide filled gaps completely for the ultimate zero-noise experience.
Global Compatibility
Tested and optimized for:
Forex : EURUSD, GBPUSD, AUDUSD.
Indices : US30, NAS100, DAX40.
Commodities : Gold (XAUUSD), Silver, Oil.
Crypto : BTCUSD, ETHUSD.
Authors Note
This script is written in Pine Script v6 . It is designed for traders who prioritize accuracy over "noisy" indicators. If you find value in this tool, please leave a Boost and follow for more SMC tool releases!

FVG Candle HighlighterThis indicator highlights only the true Fair Value Gap (FVG) creator candle — the middle candle in a 3-bar FVG formation — with zero clutter.
🔹 Bullish FVG: Candle is colored if price gaps above the high two bars back
🔹 Bearish FVG: Candle is colored if price gaps below the low two bars back
✨ No boxes. No zones. Just pure, visual price-action accuracy.
🔧 Powered by Pine Script v6
🧠 Based on institutional-style FVG logic
🎯 Ideal for Smart Money / ICT / Order Block strategies

Fractal Break Imbalance / Fair Value Gap (FVG) / Liquidity VoidFractal Break Imbalance / Fair Value Gap (FVG) / Liquidity Void
Order imbalances in either direction, either excess buy or sell orders, reduce liquidity. The market will seek to fill gaps sooner or later. The script marks an imbalance / FVG after a fractal break. It also marks any other imbalance.
Default Colours:
Green - Imbalance after fractal break to the upside
Red - Imbalance after fractal break to the downside
Yellow - Other imbalances
How To Use:
Gaps can be used to determine possible entries and targets. Those familiar with liquidity raids, supply and demand, and ICT concepts may realise it's potential.
Indicator in use:

Imbalance(FVG) DetectorImbalance (FVG) Detector
Overview
The Imbalance (FVG) Detector is a technical analysis tool designed to highlight price inefficiencies by identifying Fair Value Gaps (FVGs). These gaps occur when rapid price movement leaves an area with little to no traded volume, which may later act as a zone of interest. The indicator automatically detects and marks these imbalances on the chart, allowing users to observe historical price behavior more effectively.
Key Features
- Automatic Imbalance Detection: Identifies bullish and bearish imbalances based on a structured three-bar price action model.
- Customizable Sensitivity: Users can adjust the minimum imbalance percentage threshold to tailor detection settings to different assets and market conditions.
- Real-time Visualization: Marked imbalances are displayed as colored boxes directly on the chart.
- Dynamic Box Updates: Imbalance zones extend forward in time until price interacts with them.
- Alert System: Users can set alerts for when new imbalances appear or when price tests an existing imbalance.
How It Works
The indicator identifies market imbalances using a three-bar price structure:
- Bullish Imbalance: Occurs when the high of three bars ago is lower than the low of the previous bar, forming a price gap.
- Bearish Imbalance: Occurs when the low of three bars ago is higher than the high of the previous bar, creating a downward gap.
When an imbalance is detected:
- Green Boxes indicate bullish imbalances.
- Red Boxes indicate bearish imbalances.
- Once price interacts with an imbalance, the box fades to gray, marking it as tested.
! Designed for Crypto Markets
This indicator is particularly useful in crypto markets, where frequent volatility can create price inefficiencies. It provides a structured way to visualize gaps in price movement, helping users analyze historical liquidity areas.
Customization Options
- Min Imbalance Percentage Size: Adjusts the sensitivity of the imbalance detection.
- Alerts: Users can enable alerts to stay notified of new or tested imbalances.
Important Notes
- This indicator is a technical analysis tool and does not provide trading signals or financial advice.
- It does not predict future price movement but highlights historical price inefficiencies.
- Always use this tool alongside other market analysis methods and risk management strategies.

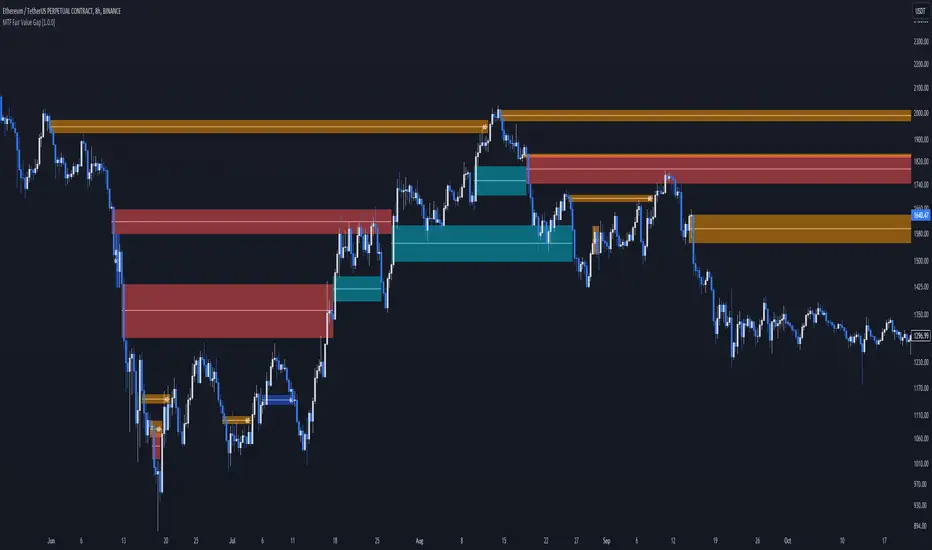
MTF Fair Value Gap [BigBeluga]The MTF Fair Value Gap (FVG) indicator provides multi-timeframe options to observe lower or higher gaps in different timeframes within your current one. This can enhance the confluence in your trading decisions.
🔶 USAGE
An FVG is formed when a candle has an 'empty' body, leaving a gap. These areas are often filled before the market continues to trend in its original direction.
In practical terms, FVGs serve to highlight support areas (bullish FVGs) and resistance zones (bearish FVGs). As a gap is filled, signaling the end of the existing imbalance, it tends to foreshadow an impending price reversal.
While this approach is inherently contrarian, individuals seeking a more trend-following strategy can opt to use FVG identification as straightforward signals. This entails taking a long position upon detecting a bullish FVG and adopting a short position in the presence of a bearish FVG.
🔹 Mitigation
The mitigation point is where the user selects when the FVG is considered filled or no longer usable.
Source => Choose the candle's low/high or close as the mitigation point.
Point => Choose the FVG's mitigation point to trigger after the candle's Source has filled it. Users can choose between the middle point or the top/bottom of the FVG.
ccc
🔹 MTF
This script can display MTF FVGs from different timeframes while showing the current one. This is extremely useful as it avoids the need to switch timeframes frequently and can add significant confluence with the current FVG.
🔹 Threshold
The Threshold is an input to remove insignificant FVGs that are too small to be truly useful. Users can choose between:
Auto => Automatically remove unusable FVGs.
Manual => Set an automatic Threshold.
🔶 TIPS
Users can choose how many FVGs to display on the current chart for better visualization.
Users can choose which FVGs to display: only the current one, only MTF ones, or both.
ICT Fair Value Gap [LM]Hello traders,
I would like to present you ICT Fair Value Gap script. The idea is the same as in my other script to look form imbalances. I have improved the previous script from teaching of ICT and created this script to train the eye to see those gaps. Shrinking option also shows if the gap has been already filled and also in case gap is filled you can get alert in case you will set it up .
The script has two settings:
general settings - definition of volatility condition for middle candle
box settings - setting for boxes, box colors, shrinking
I hope you enjoy it,
Lukas

Synapse Trade - Fair Value GapsNot your average FVG indicator. This FVG indicator allowed for overlapping, and invalidated FVGs to remain as the existence of Inversion Fair Value Gaps exists and, in my recent experience, has been incredibly useful finding new levels of support and resistance, even inside a currently FVG, the "invalidated" FVGs can still have an impact on price trend and react to it.
~edit: updated chart to be cleaner and include only the FVG indicator

Breakaway Fair Value Gaps [LuxAlgo]The Breakaway Fair Value Gap (FVG) is a typical FVG located at a point where the price is breaking new Highs or Lows.
🔶 USAGE
In the screenshot above, the price range is visualized by Donchian Channels.
In theory, the Breakaway FVGs should generally be a good indication of market participation, showing favor in the FVG's breaking direction. This is a combination of buyers or sellers pushing markets quickly while already at the highest high or lowest low in recent history.
While this described reasoning seems conventional, looking into it inversely seems to reveal a more effective use of these formations.
When the price is pushed to the extremities of the current range, the price is already potentially off balance and over-extended. Then an FVG is created, extending the price further out of balance.
With this in consideration, After identifying a Breakaway FVG, we could logically look for a reversion to re-balance the gap.
However, it would be illogical to believe that the FVG will immediately mitigate after formation. Because of this, the dashboard display for this indicator shows the analysis for the mitigation likelihood and timeliness.
In the example above, the information in the dashboard would read as follows (Bearish example):
Out of 949 Bearish Breakaway FVGs, 80.19% are shown to be mitigated within 60 bars, with the average mitigation time being 13 bars.
The other 19.81% are not mitigated within 60 bars. This could mean the FVG was mitigated after 60 bars, or it was never mitigated.
The unmitigated FVGs within the analysis window will extend their mitigation level to the current bar. We can see the number of bars since the formation is represented to the right of the live mitigation level.
Utilizing the current distance readout helps to better judge the likelihood of a level being mitigated.
Additionally, when considering these mitigation levels as targets, an additional indicator or analysis can be used to identify specific entries, which would further aid in a system's reliability.
🔶 SETTINGS
Trend Length: Sets the (DC) Trend length to use for Identifying Breakaway FVGs.
Show Mitigation Levels: Optionally hide mitigation levels if you would prefer only to see the Breakaway FVGs.
Maximum Duration: Sets the analysis duration for FVGs, Past this length in bars, the FVG is counted as "Un-Mitigated".
Show Dashboard: Optionally hide the dashboard.
Use Median Duration: Display the Median of the Bar Length data set rather than the Average.

Fair Value Gap DetectorHow this indicator works:
It detects two types of FVGs:
Bullish FVG: Occurs when the low of the current candle is higher than the high of the candle from 2 bars ago (creates an upward gap)
Bearish FVG: Occurs when the high of the current candle is lower than the low of the candle from 2 bars ago (creates a downward gap)
Features:
Allows users to toggle both bullish and bearish FVG detection independently
Customizable colors for both bullish (default green) and bearish (default red) FVGs
Visualizes FVGs using:
Boxes that highlight the gap area (with 80% transparency)
Labels that mark each FVG ("Bull FVG" or "Bear FVG")
Visual representation:
Bullish FVGs are marked with green boxes and downward-pointing labels
Bearish FVGs are marked with red boxes and upward-pointing labels
This indicator can be useful for :
Identifying potential areas where price might return to
Finding potential support and resistance zones
Understanding market structure and momentum shifts

Clean SMC: Filtered OB + FVG Fair Value Gaps (FVG): This identifies price imbalances (gaps between the wick of candle 1 and candle 3). They appear as small, light-colored rectangles.
* Order Blocks (OB): This marks "Smart Money" candles that precede a strong impulse. These areas are extended to the right because they often act as future support or resistance.
* Signals (BUY/SELL): The indicator displays a signal when it detects a confluence (for example, a bullish OB appearing right after an FVG).
Some friendly trading tips:
* Timeframe: This indicator works best on higher timeframes (15m, 1h, 4h) to avoid market "noise."
* Confirmation: Don't take a "BUY" signal alone. Check if the overall trend (on a higher timeframe) is also bullish.
* Risk management: Always place your Stop Loss just below the identified Order Block.
Would you like me to add a specific feature, such as a notification on your phone or a trend filter (moving average) to refine the signals?

Fair Value Gap (FVG) RFF001I dont what to say here but i need to write studd apparently, its really just fvgs

Fair Value Gaps (40+ Points) with NY Session AlertsFVG with alerts. This works for the NY session only.


Automatic Closest FVG with BPRFair Value Gaps are a hugely popular concept and because of that there are numerous indicators available. This one however, was designed to automate the process of actually using them in trading.
Designed with lower time frame entries in mind (though will work on HTF just as well), this indicator automatically draws the closest, non-mitigated FVG, to the current price, cutting out the work of looking for what FVG is relevant.
The indicator also has an option to show when the current nearest pair of FVGs form a BPR or 'balanced price range'.
There are various option for what counts as mitigation, including no mitigation at all, and when mitigated an FVG is no longer considered for proximity searching.

Smart Money Concepts by WeloTradesThe "Smart Money Concepts by WeloTrades" indicator is designed to offer traders a comprehensive tool that integrates multiple advanced features to aid in market analysis. By combining order blocks, liquidity levels, fair value gaps, trendlines, and market structure analysis, the indicator provides a holistic approach to understanding market dynamics and making informed trading decisions.
Components and Their Integration:
Order Blocks and Breaker Blocks Detection
Functionality: Order blocks represent areas where significant buying or selling occurred, creating potential support or resistance zones. Breaker blocks signal potential reversals.
Integration: By detecting and visualizing these blocks, the indicator helps traders identify key levels where price might react, aiding in entry and exit decisions. The customizable settings allow traders to adjust the visibility and parameters to suit their specific trading strategy.
Liquidity Levels Analysis
Functionality: Liquidity levels indicate zones where significant price movements can occur due to the presence of large orders. These are areas where smart money might be executing trades.
Integration: By tracking these high-probability liquidity areas, traders can anticipate potential price movements. Customizable display limits and mitigation strategies ensure that the information is tailored to the trader’s needs, providing precise and actionable insights.
Fair Value Gaps (FVG)
Functionality: Fair value gaps highlight areas where there is an imbalance between buyers and sellers. These gaps often represent potential trading opportunities.
Integration: The ability to identify and analyze FVGs helps traders spot potential entries based on market inefficiencies. The touch and break detection functionalities provide further refinement, enhancing the precision of trading signals.
Trendlines
Functionality: Trendlines help in identifying the direction of the market and potential reversal points. The additional trendline adds a layer of confirmation for breaks or retests.
Integration: Automatically drawn trendlines assist traders in visualizing market trends and making decisions about potential entries and exits. The additional trendline for stronger confirmation reduces the risk of false signals, providing more reliable trading opportunities.
Market Structure Analysis
Functionality: Understanding market structure is crucial for identifying key support and resistance levels and overall market dynamics. This component displays internal, external, and composite market structures.
Integration: By automatically highlighting shifts in market structure, the indicator helps traders recognize important levels and potential changes in market direction. This analysis is critical for strategic planning and execution in trading.
Customizable Alerts
Functionality: Alerts ensure that traders do not miss significant market events, such as the formation or breach of order blocks, liquidity levels, and trendline interactions.
Integration: Customizable alerts enhance the user experience by providing timely notifications of key events. This feature ensures that traders can act quickly and efficiently, leveraging the insights provided by the indicator.
Interactive Visualization
Functionality: Customizable visual aspects of the indicator allow traders to tailor the display to their preferences and trading style.
Integration: This feature enhances user engagement and usability, making it easier for traders to interpret the data and make informed decisions. Personalization options like colors, styles, and display formats improve the overall effectiveness of the indicator.
How Components Work Together
Comprehensive Market Analysis
Each component of the indicator addresses a different aspect of market analysis. Order blocks and liquidity levels highlight potential support and resistance zones, while fair value gaps and trendlines provide additional context for potential entries and exits. Market structure analysis ties everything together by offering a broad view of market dynamics.
Synergistic Insights
The integration of multiple features allows for cross-validation of trading signals. For instance, an order block coinciding with a high-probability liquidity level and a fair value gap can provide a stronger signal than any of these features alone. This synergy enhances the reliability of the insights and trading signals generated by the indicator.
Enhanced Decision Making
By combining these advanced features into a single tool, traders are equipped with a powerful resource for making informed decisions. The customizable alerts and interactive visualization further support this by ensuring that traders can act quickly on the insights provided.
Order Blocks ( OB) & Breaker Blocks (BB) Visuals:
📝 OB Input Settings
📊 Timeframe #1
TF #1🕑: Enable or disable Timeframe 1.
What it is: A boolean input to toggle the use of the first timeframe.
What it does: Enables or disables Timeframe 1 for the OB settings.
How to use it: Check or uncheck the box to enable or disable.
📊 Timeframe 1 Selection
Timeframe #1🕑: Select the timeframe for Timeframe 1.
What it is: A dropdown to select the desired timeframe.
What it does: Sets the timeframe for Timeframe 1.
How to use it: Choose a timeframe from the dropdown list.
📊 Timeframe #2
TF #2🕑: Enable or disable Timeframe 2.
What it is: A boolean input to toggle the use of the second timeframe.
What it does: Enables or disables Timeframe 2 for the OB settings.
How to use it: Check or uncheck the box to enable or disable.
📊 Timeframe 2 Selection
Timeframe #2🕑: Select the timeframe for Timeframe 2.
What it is: A dropdown to select the desired timeframe.
What it does: Sets the timeframe for Timeframe 2.
How to use it: Choose a timeframe from the dropdown list.
Additional Info: Higher TF Chart & Lower TF Setting / Lower TF Chart & Higher TF Setting.
📏 Show OBs
OB (Length)📏: Toggle the display of Order Blocks.
What it is: A boolean input to enable or disable the display of Order Blocks.
What it does: Shows or hides Order Blocks based on the selected swing length.
How to use it: Check or uncheck the box to enable or disable.
📏 Swing Length Option
Swing Length Option: Select the swing length option.
What it is: A dropdown to choose between SHORT, MID, LONG, or CUSTOM.
What it does: Sets the length of swings for Order Blocks.
How to use it: Choose an option from the dropdown.
Additional Info: Default lengths are SHORT=10, MID=28, LONG=50.
🔧 Custom Swing Length
🔧custom: Specify a custom swing length.
What it is: An integer input for setting a custom swing length.
What it does: Overrides the default swing lengths if set to CUSTOM.
How to use it: Enter a custom integer value (only shown when CUSTOM is selected).
📛 Show BBs
BB (Method)📛: Toggle the display of Breaker Blocks.
What it is: A boolean input to enable or disable the display of Breaker Blocks.
What it does: Shows or hides Breaker Blocks.
How to use it: Check or uncheck the box to enable or disable.
📛 OB End Method
OB End Method: Select the method for determining the end of a Breaker Block.
What it is: A dropdown to choose between Wick and Close.
What it does: Sets the criteria for when a Breaker Block is considered mitigated.
How to use it: Choose an option from the dropdown.
Additional Info: Wicks: OB is mitigated when the price wicks through the OB Level. Close: OB is mitigated when the closing price is within the OB Level.
🔍 Max Bullish Zones
🔍Max Bullish: Set the maximum number of Bullish Order Blocks to display.
What it is: A dropdown to select the maximum number of Bullish Order Blocks.
What it does: Limits the number of Bullish Order Blocks shown on the chart.
How to use it: Choose a value from the dropdown (1-10).
🔍 Max Bearish Zones
🔍Max Bearish: Set the maximum number of Bearish Order Blocks to display.
What it is: A dropdown to select the maximum number of Bearish Order Blocks.
What it does: Limits the number of Bearish Order Blocks shown on the chart.
How to use it: Choose a value from the dropdown (1-10).
🟩 Bullish OB Color
Bullish OB Color: Set the color for Bullish Order Blocks.
What it is: A color picker to set the color of Bullish Order Blocks.
What it does: Changes the color of Bullish Order Blocks on the chart.
How to use it: Select a color from the color picker.
🟥 Bearish OB Color
Bearish OB Color: Set the color for Bearish Order Blocks.
What it is: A color picker to set the color of Bearish Order Blocks.
What it does: Changes the color of Bearish Order Blocks on the chart.
How to use it: Select a color from the color picker.
🔧 OB & BB Range
↔ OB & BB Range: Select the range option for OB and BB.
What it is: A dropdown to choose between RANGE and CUSTOM.
What it does: Sets how far the OB or BB should extend.
How to use it: Choose an option from the dropdown.
Additional Info: RANGE = Current price, CUSTOM = Adjustable Range.
🔧 Custom OB & BB Range
🔧Custom: Specify a custom range for OB and BB.
What it is: An integer input for setting a custom range.
What it does: Defines how far the OB or BB should go, based on a custom value.
How to use it: Enter a custom integer value (range: 1000-500000).
💬 Text Options
💬Text Options: Set text size and color for OB and BB.
What it is: A dropdown to select text size and a color picker to choose text color.
What it does: Changes the size and color of the text displayed for OB and BB.
How to use it: Select a size from the dropdown and a color from the color picker.
💬 Show Timeframe OB
Text: Toggle to display the timeframe of OB.
What it is: A boolean input to show or hide the timeframe text for OB.
What it does: Displays the timeframe information for Order Blocks on the chart.
How to use it: Check or uncheck the box to enable or disable.
💬 Show Volume
Volume: Toggle to display the volume of OB.
What it is: A boolean input to show or hide the volume information for Order Blocks.
What it does: Displays the volume information for Order Blocks on the chart.
How to use it: Check or uncheck the box to enable or disable.
Additional Info:
What it represents: The volume displayed represents the total trading volume that occurred during the formation of the Order Block. This can indicate the level of participation or interest in that price level.
How it's calculated: The volume is the sum of all traded volumes within the candles that form the Order Block.
What it means: Higher volume at an Order Block level may suggest stronger support or resistance. It shows the amount of trading activity and can be an indicator of the potential strength or validity of the Order Block.
Why it's shown: To give traders an idea of the market participation and to help assess the strength of the Order Block.
💬 Show Percentage
%: Toggle to display the percentage of OB.
What it is: A boolean input to show or hide the percentage information for Order Blocks.
What it does: Displays the percentage information for Order Blocks on the chart.
How to use it: Check or uncheck the box to enable or disable.
Additional Info:
What it represents: The percentage displayed usually represents the proportion of price movement relative to the Order Block.
How it's calculated: This can be the percentage move from the start to the end of the Order Block or the retracement level that price has reached relative to the Order Block's range.
What it means: It helps traders understand the extent of price movement within the Order Block and can indicate the significance of the price level.
Why it's shown: To provide a clearer understanding of the price dynamics and the importance of the Order Block within the overall price movement.
Additional Information
Volume Example: If an Order Block forms over three candles with volumes of 100, 150, and 200, the total volume displayed for that Order Block would be 450.
Percentage Example: If the price moves from 100 to 110 within an Order Block, and the total range of the Order Block is from 100 to 120, the percentage shown might be 50% (since the price has moved halfway through the Order Block's range).
Liquidity Levels visuals:
📊 Liquidity Levels Input Settings
📊 Current Timeframe
TF #1🕑: Enable or disable the current timeframe.
What it is: A boolean input to toggle the use of the current timeframe.
What it does: Enables or disables the display of liquidity levels for the current timeframe.
How to use it: Check or uncheck the box to enable or disable.
📊 Higher Timeframe
Higher Timeframe: Select the higher timeframe for liquidity levels.
What it is: A dropdown to select the desired higher timeframe.
What it does: Sets the higher timeframe for liquidity levels.
How to use it: Choose a timeframe from the dropdown list.
📏 Liquidity Length Option
📏Liquidity Length: Select the length for liquidity levels.
What it is: A dropdown to choose between SHORT, MID, LONG, or CUSTOM.
What it does: Sets the length of swings for liquidity levels.
How to use it: Choose an option from the dropdown.
Additional Info: Default lengths are SHORT=10, MID=28, LONG=50.
🔧 Custom Liquidity Length
🔧custom: Specify a custom length for liquidity levels.
What it is: An integer input for setting a custom swing length.
What it does: Overrides the default liquidity lengths if set to CUSTOM.
How to use it: Enter a custom integer value (only shown when CUSTOM is selected).
📛 Mitigation Method
📛Mitigation (Method): Select the method for determining the mitigation of liquidity levels.
What it is: A dropdown to choose between Close and Wick.
What it does: Sets the criteria for when a liquidity level is considered mitigated.
How to use it: Choose an option from the dropdown.
Additional Info:
Wick: Level is mitigated when the price wicks through the level.
Close: Level is mitigated when the closing price is within the level.
📛 Display Mitigated Levels
-: Select to display or hide mitigated levels.
What it is: A dropdown to choose between Remove and Show.
What it does: Displays or hides mitigated liquidity levels.
How to use it: Choose an option from the dropdown.
Additional Info:
Remove: Hide mitigated levels.
Show: Display mitigated levels.
🔍 Max Buy Side Liquidity
🔍Max Buy Side Liquidity: Set the maximum number of Buy Side Liquidity Levels to display.
What it is: An integer input to set the maximum number of Buy Side Liquidity Levels.
What it does: Limits the number of Buy Side Liquidity Levels shown on the chart.
How to use it: Enter a value between 0 and 50.
🟦 Buy Side Liquidity Color
Buy Side Liquidity Color: Set the color for Buy Side Liquidity Levels.
What it is: A color picker to set the color of Buy Side Liquidity Levels.
What it does: Changes the color of Buy Side Liquidity Levels on the chart.
How to use it: Select a color from the color picker.
Additional Info:
Tooltip: Set the maximum number of Buy Side Liquidity Levels to display. Default: 5, Min: 1, Max: 50.
If liquidity levels are not displayed as expected, try increasing the max count.
🔍 Max Sell Side Liquidity
🔍Max Sell Side Liquidity: Set the maximum number of Sell Side Liquidity Levels to display.
What it is: An integer input to set the maximum number of Sell Side Liquidity Levels.
What it does: Limits the number of Sell Side Liquidity Levels shown on the chart.
How to use it: Enter a value between 0 and 50.
🟥 Sell Side Liquidity Color
Sell Side Liquidity Color: Set the color for Sell Side Liquidity Levels.
What it is: A color picker to set the color of Sell Side Liquidity Levels.
What it does: Changes the color of Sell Side Liquidity Levels on the chart.
How to use it: Select a color from the color picker.
Additional Info:
Tooltip: Set the maximum number of Sell Side Liquidity Levels to display. Default: 5, Min: 1, Max: 50.
If liquidity levels are not displayed as expected, try increasing the max count.
✂ Box Style (Height)
✂ Box Style (↕): Set the box height style for liquidity levels.
What it is: A float input to set the height of the boxes.
What it does: Adjusts the height of the boxes displaying liquidity levels.
How to use it: Enter a value between -50 and 50.
Additional Info: Default value is -5.
📏 Box Length
b: Set the box length of liquidity levels.
What it is: An integer input to set the length of the boxes.
What it does: Adjusts the length of the boxes displaying liquidity levels.
How to use it: Enter a value between 0 and 500.
Additional Info: Default value is 20.
⏭ Extend Liquidity Levels
Extend ⏭: Toggle to extend liquidity levels beyond the current range.
What it is: A boolean input to enable or disable the extension of liquidity levels.
What it does: Extends liquidity levels beyond their default range.
How to use it: Check or uncheck the box to enable or disable.
Additional Info: Extend liquidity levels beyond the current range.
💬 Text Options
💬 Text Options: Set text size and color for liquidity levels.
What it is: A dropdown to select text size and a color picker to choose text color.
What it does: Changes the size and color of the text displayed for liquidity levels.
How to use it: Select a size from the dropdown and a color from the color picker.
💬 Show Text
Text: Toggle to display text for liquidity levels.
What it is: A boolean input to show or hide the text for liquidity levels.
What it does: Displays the text information for liquidity levels on the chart.
How to use it: Check or uncheck the box to enable or disable.
💬 Show Volume
Volume: Toggle to display the volume of liquidity levels.
What it is: A boolean input to show or hide the volume information for liquidity levels.
What it does: Displays the volume information for liquidity levels on the chart.
How to use it: Check or uncheck the box to enable or disable.
Additional Info:
What it represents: The volume displayed represents the total trading volume that occurred during the formation of the liquidity level. This can indicate the level of participation or interest in that price level.
How it's calculated: The volume is the sum of all traded volumes within the candles that form the liquidity level.
What it means: Higher volume at a liquidity level may suggest stronger support or resistance. It shows the amount of trading activity and can be an indicator of the potential strength or validity of the liquidity level.
Why it's shown: To give traders an idea of the market participation and to help assess the strength of the liquidity level.
💬 Show Percentage
%: Toggle to display the percentage of liquidity levels.
What it is: A boolean input to show or hide the percentage information for liquidity levels.
What it does: Displays the percentage information for liquidity levels on the chart.
How to use it: Check or uncheck the box to enable or disable.
Additional Info:
What it represents: The percentage displayed usually represents the proportion of price movement relative to the liquidity level.
How it's calculated: This can be the percentage move from the start to the end of the liquidity level or the retracement level that price has reached relative to the liquidity level's range.
What it means: It helps traders understand the extent of price movement within the liquidity level and can indicate the significance of the price level.
Why it's shown: To provide a clearer understanding of the price dynamics and the importance of the liquidity level within the overall price movement.
Fair Value Gaps visuals:
📊 Fair Value Gaps Input Settings
📊 Show FVG
TF #1🕑: Enable or disable Fair Value Gaps for Timeframe 1.
What it is: A boolean input to toggle the display of Fair Value Gaps.
What it does: Shows or hides Fair Value Gaps on the chart.
How to use it: Check or uncheck the box to enable or disable.
📊 Select Timeframe
Timeframe: Select the timeframe for Fair Value Gaps.
What it is: A dropdown to select the desired timeframe.
What it does: Sets the timeframe for Fair Value Gaps.
How to use it: Choose a timeframe from the dropdown list.
Additional Info: Higher TF Chart & Lower TF Setting or Lower TF Chart & Higher TF Setting.
📛 FVG Break Method
📛FVG Break (Method): Select the method for determining when an FVG is mitigated.
What it is: A dropdown to choose between Touch, Wicks, Close, or Average.
What it does: Sets the criteria for when a Fair Value Gap is considered mitigated.
How to use it: Choose an option from the dropdown.
Additional Info:
Touch: FVG is mitigated when the price touches the gap.
Wicks: FVG is mitigated when the price wicks through the gap.
Close: FVG is mitigated when the closing price is within the gap.
Average: FVG is mitigated when the average price (average of high and low) is within the gap.
📛 Show Mitigated FVG
show: Toggle to display mitigated FVGs.
What it is: A boolean input to show or hide mitigated Fair Value Gaps.
What it does: Displays or hides mitigated Fair Value Gaps.
How to use it: Check or uncheck the box to enable or disable.
📛 Fill FVG
Fill: Toggle to fill Fair Value Gaps.
What it is: A boolean input to fill the Fair Value Gaps with color.
What it does: Adds a color fill to the Fair Value Gaps.
How to use it: Check or uncheck the box to enable or disable.
📛 Shade FVG
Shade: Toggle to shade Fair Value Gaps.
What it is: A boolean input to shade the Fair Value Gaps.
What it does: Adds a shade effect to the Fair Value Gaps.
How to use it: Check or uncheck the box to enable or disable.
Additional Info: Select the method to break FVGs and toggle the visibility of FVG Breaks (fill FVG and/or shade FVG).
🔍 Max Bullish FVG
🔍Max Bullish FVG: Set the maximum number of Bullish Fair Value Gaps to display.
What it is: An integer input to set the maximum number of Bullish Fair Value Gaps.
What it does: Limits the number of Bullish Fair Value Gaps shown on the chart.
How to use it: Enter a value between 0 and 50.
🔍 Max Bearish FVG
🔍Max Bearish FVG: Set the maximum number of Bearish Fair Value Gaps to display.
What it is: An integer input to set the maximum number of Bearish Fair Value Gaps.
What it does: Limits the number of Bearish Fair Value Gaps shown on the chart.
How to use it: Enter a value between 0 and 50.
🟥 Bearish FVG Color
Bearish FVG Color: Set the color for Bearish Fair Value Gaps.
What it is: A color picker to set the color of Bearish Fair Value Gaps.
What it does: Changes the color of Bearish Fair Value Gaps on the chart.
How to use it: Select a color from the color picker.
Additional Info:
Tooltip: Set the maximum number of Bearish Fair Value Gaps to display. Default: 5, Min: 1, Max: 50.
If Fair Value Gaps are not displayed as expected, try increasing the max count.
🟦 Bullish FVG Color
Bullish FVG Color: Set the color for Bullish Fair Value Gaps.
What it is: A color picker to set the color of Bullish Fair Value Gaps.
What it does: Changes the color of Bullish Fair Value Gaps on the chart.
How to use it: Select a color from the color picker.
Additional Info:
Tooltip: Set the maximum number of Bullish Fair Value Gaps to display. Default: 5, Min: 1, Max: 50.
If Fair Value Gaps are not displayed as expected, try increasing the max count.
📏 FVG Range
↔ FVG Range: Set the range for Fair Value Gaps.
What it is: An integer input to set the range of the Fair Value Gaps.
What it does: Adjusts the range of the Fair Value Gaps displayed.
How to use it: Enter a value between 0 and 100.
Additional Info: Adjustable length only works when both RANGE & EXTEND display OFF. Range=current price, Extend=Full Range.
⏭ Extend FVG
Extend⏭: Toggle to extend Fair Value Gaps beyond the current range.
What it is: A boolean input to enable or disable the extension of Fair Value Gaps.
What it does: Extends Fair Value Gaps beyond their default range.
How to use it: Check or uncheck the box to enable or disable.
⏯ FVG Range
Range⏯: Toggle the range of Fair Value Gaps.
What it is: A boolean input to enable or disable the range display for Fair Value Gaps.
What it does: Sets the range of Fair Value Gaps displayed.
How to use it: Check or uncheck the box to enable or disable.
↕ Max Width
↕ Max Width: Set the maximum width of Fair Value Gaps.
What it is: A float input to set the maximum width of Fair Value Gaps.
What it does: Limits the width of Fair Value Gaps as a percentage of the price range.
How to use it: Enter a value between 0 and 5.0.
Additional Info: FVGs wider than this value will be ignored.
♻ Filter FVG
Filter FVG ♻: Toggle to filter out small Fair Value Gaps.
What it is: A boolean input to filter out small Fair Value Gaps.
What it does: Ignores Fair Value Gaps smaller than the specified max width.
How to use it: Check or uncheck the box to enable or disable.
➖ Mid Line Style
➖Mid Line Style: Select the style of the mid line for Fair Value Gaps.
What it is: A dropdown to choose between Solid, Dashed, or Dotted.
What it does: Sets the style of the mid line within Fair Value Gaps.
How to use it: Choose an option from the dropdown.
🎨 Mid Line Color
Mid Line Color: Set the color for the mid line within Fair Value Gaps.
What it is: A color picker to set the color of the mid line.
What it does: Changes the color of the mid line within Fair Value Gaps.
How to use it: Select a color from the color picker.
Additional Information
Mitigation Methods: Each method (Touch, Wicks, Close, Average) provides different criteria for when a Fair Value Gap is considered mitigated, helping traders to understand the dynamics of price movements within gaps.
Volume and Percentage: Displaying volume and percentage information for Fair Value Gaps helps traders gauge the strength and significance of these gaps in relation to trading activity and price movements.
Trendlines visuals:
📊 Trendlines Input Settings
📊 Show Trendlines
Trendlines & Trendlines Difference(%) ↕: Enable or disable trendlines and set the percentage difference from the first trendline.
What it is: A boolean input to toggle the display of trendlines.
What it does: Shows or hides trendlines on the chart and allows setting a percentage difference from the first trendline.
How to use it: Check or uncheck the box to enable or disable.
Additional Info: The percentage difference determines the distance of the second trendline from the first one.
📏 Trendline Length Option
📏Trendline Length: Select the length for trendlines.
What it is: A dropdown to choose between SHORT, MID, LONG, or CUSTOM.
What it does: Sets the length of trendlines.
How to use it: Choose an option from the dropdown.
Additional Info: Default lengths are SHORT=50, MID=100, LONG=200.
🔧 Custom Trendline Length
🔧custom: Specify a custom length for trendlines.
What it is: An integer input for setting a custom trendline length.
What it does: Overrides the default trendline lengths if set to CUSTOM.
How to use it: Enter a custom integer value (only shown when CUSTOM is selected).
🔍 Max Bearish Trendlines
🔍Max Trendlines Bearish: Set the maximum number of bearish trendlines to display.
What it is: A dropdown to select the maximum number of bearish trendlines.
What it does: Limits the number of bearish trendlines shown on the chart.
How to use it: Choose a value from the dropdown (2-20).
🟩 Bearish Trendline Color
Bearish Trendline Color: Set the color for bearish trendlines.
What it is: A color picker to set the color of bearish trendlines.
What it does: Changes the color of bearish trendlines on the chart.
How to use it: Select a color from the color picker.
Additional Info: Adjust to control how many bearish trendlines are displayed.
🔍 Max Bullish Trendlines
🔍Max Trendlines Bullish: Set the maximum number of bullish trendlines to display.
What it is: A dropdown to select the maximum number of bullish trendlines.
What it does: Limits the number of bullish trendlines shown on the chart.
How to use it: Choose a value from the dropdown (2-20).
🟥 Bullish Trendline Color
Bullish Trendline Color: Set the color for bullish trendlines.
What it is: A color picker to set the color of bullish trendlines.
What it does: Changes the color of bullish trendlines on the chart.
How to use it: Select a color from the color picker.
Additional Info: Adjust to control how many bullish trendlines are displayed.
📐 Degrees Text
📐Degrees ° (💬 Size): Enable or disable degrees text and set its size and color.
What it is: A boolean input to show or hide the degrees text for trendlines.
What it does: Displays the degrees text for trendlines.
How to use it: Check or uncheck the box to enable or disable.
📏 Text Size for Degrees
Text Size: Set the text size for degrees on trendlines.
What it is: A dropdown to select the size of the degrees text.
What it does: Changes the size of the degrees text displayed for trendlines.
How to use it: Choose a size from the dropdown (XS, S, M, L, XL).
🎨 Degrees Text Color
Degrees Text Color: Set the color for the degrees text on trendlines.
What it is: A color picker to set the color of the degrees text.
What it does: Changes the color of the degrees text on the chart.
How to use it: Select a color from the color picker.
♻ Filter Degrees
♻ Filter Degrees °: Enable or disable angle filtering and set the angle range.
What it is: A boolean input to filter trendlines by their angle.
What it does: Shows only trendlines within a specified angle range.
How to use it: Check or uncheck the box to enable or disable.
Additional Info: Angles outside this range will be filtered out.
🔢 Angle Range
Angle Range: Set the angle range for filtering trendlines.
What it is: Two float inputs to set the minimum and maximum angle for trendlines.
What it does: Defines the range of angles for which trendlines will be shown.
How to use it: Enter values for the minimum and maximum angles.
➖ Line Style
➖Style #1 & #2: Select the style of the primary and secondary trendlines.
What it is: Two dropdowns to choose between Solid, Dashed, or Dotted for the trendlines.
What it does: Sets the style of the primary and secondary trendlines.
How to use it: Choose a style from each dropdown.
📏 Line Thickness
: Set the thickness for the trendlines.
What it is: An integer input to set the thickness of the trendlines.
What it does: Adjusts the thickness of the trendlines displayed on the chart.
How to use it: Enter a value between 1 and 5.
Additional Information
Trendline Percentage Difference: Setting a percentage difference helps in analyzing the relative position and angle of trendlines.
Filtering by Angle: This feature allows focusing on trendlines within a specific angle range, enhancing the clarity of trend analysis.
BOS & CHOCH Market Structure visuals:
📊 BOS & CHOCH Market Structure Input Settings
📏 Market Structure Length Option
📏Market Structure: Select the market structure length option.
What it is: A dropdown to choose between INTERNAL, EXTERNAL, ALL, CUSTOM, or NONE.
What it does: Sets the type of market structure to be displayed.
How to use it: Choose an option from the dropdown.
Additional Info:
INTERNAL: Only internal structure.
EXTERNAL: Only external structure.
ALL: Both internal and external structures.
CUSTOM: Custom lengths.
NONE: No structure.
🔧 Custom Internal Length
🔧Custom Internal: Specify a custom length for internal market structure.
What it is: An integer input for setting a custom internal length.
What it does: Defines the length of internal market structures if CUSTOM is selected.
How to use it: Enter a custom integer value (only shown when CUSTOM is selected).
💬 Internal Label Size
💬Internal Label Size: Set the label size for internal market structures.
What it is: A dropdown to select the size of the labels.
What it does: Changes the size of the labels for internal market structures.
How to use it: Choose a size from the dropdown (XS, S, M, L, XL).
🟩 Internal Bullish Color
Internal Bullish Color: Set the color for bullish internal market structures.
What it is: A color picker to set the color of bullish internal market structures.
What it does: Changes the color of bullish internal market structures on the chart.
How to use it: Select a color from the color picker.
🟥 Internal Bearish Color
Internal Bearish Color: Set the color for bearish internal market structures.
What it is: A color picker to set the color of bearish internal market structures.
What it does: Changes the color of bearish internal market structures on the chart.
How to use it: Select a color from the color picker.
🔧 Custom External Length
🔧Custom External: Specify a custom length for external market structure.
What it is: An integer input for setting a custom external length.
What it does: Defines the length of external market structures if CUSTOM is selected.
How to use it: Enter a custom integer value (only shown when CUSTOM is selected).
💬 External Label Size
💬External Label Size: Set the label size for external market structures.
What it is: A dropdown to select the size of the labels.
What it does: Changes the size of the labels for external market structures.
How to use it: Choose a size from the dropdown (XS, S, M, L, XL).
🟩 External Bullish Color
External Bullish Color: Set the color for bullish external market structures.
What it is: A color picker to set the color of bullish external market structures.
What it does: Changes the color of bullish external market structures on the chart.
How to use it: Select a color from the color picker.
🟥 External Bearish Color
External Bearish Color: Set the color for bearish external market structures.
What it is: A color picker to set the color of bearish external market structures.
What it does: Changes the color of bearish external market structures on the chart.
How to use it: Select a color from the color picker.
📐 Show Equal Highs and Lows
EQL & EQH📐: Toggle visibility for equal highs and lows.
What it is: A boolean input to show or hide equal highs and lows.
What it does: Displays or hides equal highs and lows on the chart.
How to use it: Check or uncheck the box to enable or disable.
📏 Equal Highs and Lows Threshold
Equal Highs and Lows Threshold: Set the threshold for equal highs and lows.
What it is: A float input to set the threshold for equal highs and lows.
What it does: Defines the range within which highs and lows are considered equal.
How to use it: Enter a value between 0 and 10.
💬 Label Size for Equal Highs and Lows
💬Label Size for Equal Highs and Lows: Set the label size for equal highs and lows.
What it is: A dropdown to select the size of the labels.
What it does: Changes the size of the labels for equal highs and lows.
How to use it: Choose a size from the dropdown (XS, S, M, L, XL).
🟩 Bullish Color for Equal Highs and Lows
Bullish Color for Equal Highs and Lows: Set the color for bullish equal highs and lows.
What it is: A color picker to set the color of bullish equal highs and lows.
What it does: Changes the color of bullish equal highs and lows on the chart.
How to use it: Select a color from the color picker.
🟥 Bearish Color for Equal Highs and Lows
Bearish Color for Equal Highs and Lows: Set the color for bearish equal highs and lows.
What it is: A color picker to set the color of bearish equal highs and lows.
What it does: Changes the color of bearish equal highs and lows on the chart.
How to use it: Select a color from the color picker.
📏 Show Swing Points
Swing Points📏: Toggle visibility for swing points.
What it is: A boolean input to show or hide swing points.
What it does: Displays or hides swing points on the chart.
How to use it: Check or uncheck the box to enable or disable.
📏 Swing Points Length Option
Swing Points Length Option: Select the length for swing points.
What it is: A dropdown to choose between SHORT, MID, LONG, or CUSTOM.
What it does: Sets the length of swing points.
How to use it: Choose an option from the dropdown.
Additional Info: Default lengths are SHORT=10, MID=28, LONG=50.
💬 Swing Points Label Size
💬Swing Points Label Size: Set the label size for swing points.
What it is: A dropdown to select the size of the labels.
What it does: Changes the size of the labels for swing points.
How to use it: Choose a size from the dropdown (XS, S, M, L, XL).
🎨 Swing Points Color
Swing Points Color: Set the color for swing points.
What it is: A color picker to set the color of swing points.
What it does: Changes the color of swing points on the chart.
How to use it: Select a color from the color picker.
🔧 Custom Swing Points Length
🔧Custom Swings: Specify a custom length for swing points.
What it is: An integer input for setting a custom length for swing points.
What it does: Defines the length of swing points if CUSTOM is selected.
How to use it: Enter a custom integer value (only shown when CUSTOM is selected).
Additional Information
Market Structure Types: Understanding internal and external structures helps in analyzing different market behaviors.
Equal Highs and Lows: This feature identifies areas where price action is balanced, which can be significant for trading strategies.
Swing Points: Highlighting swing points aids in recognizing significant market reversals or continuations.
Benefits
Enhance your trading strategy by visualizing smart money's influence on price movements.
Make informed decisions with real-time data on significant market structures.
Reduce manual analysis with automated detection of key trading signals.
Ideal For
Traders looking for an edge in forex, equities, and cryptocurrency markets by understanding the underlying forces driving market dynamics.
Acknowledgements
Special thanks to these amazing creators for inspiration and their creations:
I want to thank these amazing creators for creating there amazing indicators , that inspired me and also gave me a head start by making this indicator! Without their amazing indicators it wouldn't be possible!
Flux Charts: Volumized Order Blocks
LuxAlgo: Trend Lines
UAlgo: Fair Value Gaps (FVG)
By Leviathan: Market Structure
Sonarlab: Liquidity Levels
Note
Remember to always backtest the indicator first before integrating it into your strategy! For any questions about the indicator, please feel free to ask for assistance.

Smart Money Flow Index (SMFI) - Advanced SMC [PhenLabs]📊Smart Money Flow Index (SMFI)
Version: PineScript™v6
📌Description
The Smart Money Flow Index (SMFI) is an advanced Smart Money Concepts implementation that tracks institutional trading behavior through multi-dimensional analysis. This comprehensive indicator combines volume-validated Order Block detection, Fair Value Gap identification with auto-mitigation tracking, dynamic Liquidity Zone mapping, and Break of Structure/Change of Character detection into a unified system.
Unlike basic SMC indicators, SMFI employs a proprietary scoring algorithm that weighs five critical factors: Order Block strength (validated by volume), Fair Value Gap size and recency, proximity to Liquidity Zones, market structure alignment (BOS/CHoCH), and multi-timeframe confluence. This produces a Smart Money Score (0-100) where readings above 70 represent optimal institutional setup conditions.
🚀Points of Innovation
Volume-Validated Order Block Detection – Only displays Order Blocks when formation candle exceeds customizable volume multiplier (default 1.5x average), filtering weak zones and highlighting true institutional accumulation/distribution
Auto-Mitigation Tracking System – Fair Value Gaps and Order Blocks automatically update status when price mitigates them, with visual distinction between active and filled zones preventing trades on dead levels
Proprietary Smart Money Score Algorithm – Combines weighted factors (OB strength 25%, FVG proximity 20%, Liquidity 20%, Structure 20%, MTF 15%) into single 0-100 confidence rating updating in real-time
ATR-Based Adaptive Calculations – All distance measurements use 14-period Average True Range ensuring consistent function across any instrument, timeframe, or volatility regime without manual recalibration
Dynamic Age Filtering – Automatically removes liquidity levels and FVGs older than configurable thresholds preventing chart clutter while maintaining relevant levels
Multi-Timeframe Confluence Integration – Analyzes higher timeframe bias with customizable multipliers (2-10x) and incorporates HTF trend direction into Smart Money Score for institutional alignment
🔧Core Components
Order Block Engine – Detects institutional supply/demand zones using characteristic patterns (down-move-then-strong-up for bullish, up-move-then-strong-down for bearish) with minimum volume threshold validation, tracks mitigation when price closes through zones
Fair Value Gap Scanner – Identifies price imbalances where current candle's low/high leaves gap with two-candle-prior high/low, filters by minimum size percentage, monitors 50% fill for mitigation status
Liquidity Zone Mapper – Uses pivot high/low detection with configurable lookback to mark swing points where stop losses cluster, extends horizontal lines to visualize sweep targets, manages lifecycle through age-based removal
Market Structure Analyzer – Tracks pivot progression to identify trend through higher-highs/higher-lows (bullish) or lower-highs/lower-lows (bearish), detects Break of Structure and Change of Character for trend/reversal confirmation
Scoring Calculation Engine – Evaluates proximity to nearest Order Blocks using ATR-normalized distance, assesses FVG recency and distance, calculates liquidity proximity with age weighting, combines structure bias and MTF trend into smoothed final score
🔥Key Features
Customizable Display Limits – Control maximum Order Blocks (1-10), Liquidity Zones (1-10), and FVG age (10-200 bars) to maintain clean charts focused on most relevant institutional levels
Gradient Strength Visualization – All zones render with transparency-adjustable coloring where stronger/newer zones appear more solid and weaker/older zones fade progressively providing instant visual hierarchy
Educational Label System – Optional labels identify each zone type (Bullish OB, Bearish OB, Bullish FVG, Bearish FVG, BOS) with color-coded text helping traders learn SMC concepts through practical application
Real-Time Smart Money Score Dashboard – Top-right table displays current score (0-100) with color coding (green >70, yellow 30-70, red <30) plus trend arrow for at-a-glance confidence assessment
Comprehensive Alert Suite – Configurable notifications for Order Block formation, Fair Value Gap detection, Break of Structure events, Change of Character signals, and high Smart Money Score readings (>70)
Buy/Sell Signal Integration – Automatically plots triangle markers when Smart Money Score exceeds 70 with aligned market structure and fresh Order Block detection providing clear entry signals
🎨Visualization
Order Block Boxes – Shaded rectangles extend from formation bar spanning high-to-low of institutional candle, bullish zones in green, bearish in red, with customizable transparency (80-98%)
Fair Value Gap Zones – Rectangular areas marking imbalances, active FVGs display in bright colors with adjustable transparency, mitigated FVGs switch to gray preventing trades on filled zones
Liquidity Level Lines – Dashed horizontal lines extend from pivot creation points, swing highs in bearish color (short targets above), swing lows in bullish color (long targets below), opacity decreases with age
Structure Labels – "BOS" labels appear above/below price when Break of Structure confirmed, colored by direction (green bullish, red bearish), positioned at 1% beyond highs/lows for visibility
Educational Info Panel – Bottom-right table explains key terminology (OB, FVG, BOS, CHoCH) and score interpretation (>70 high probability) with semi-transparent background for readability
📖Usage Guidelines
General Settings
Show Order Blocks – Default: On, toggles visibility of institutional supply/demand zones, disable when focusing solely on FVGs or Liquidity
Show Fair Value Gaps – Default: On, controls FVG zone display including active and mitigated imbalances
Show Liquidity Zones – Default: On, manages liquidity line visibility, disable on lower timeframes to reduce clutter
Show Market Structure – Default: On, toggles BOS/CHoCH label display
Show Smart Money Score – Default: On, controls score dashboard visibility
Order Block Settings
OB Lookback Period – Default: 20, Range: 5-100, controls bars scanned for Order Block patterns, lower values detect recent activity, higher values find older blocks
Min Volume Multiplier – Default: 1.5, Range: 1.0-5.0, sets minimum volume threshold as multiple of 20-period average, higher values (2.0+) filter for strongest institutional candles
Max Order Blocks to Display – Default: 3, Range: 1-10, limits simultaneous Order Blocks shown, lower settings (1-3) maintain focus on most recent zones
Fair Value Gap Settings
Min FVG Size (%) – Default: 0.3, Range: 0.1-2.0, defines minimum gap size as percentage of close price, lower values detect micro-imbalances, higher values focus on significant gaps
Max FVG Age (bars) – Default: 50, Range: 10-200, removes FVGs older than specified bars, lower settings (10-30) for scalping, higher (100-200) for swing trading
Show FVG Mitigation – Default: On, displays filled FVGs in gray providing visual history, disable to show only active untouched imbalances
Liquidity Zone Settings
Liquidity Lookback – Default: 50, Range: 20-200, sets pivot detection period for swing highs/lows, lower values (20-50) mark shorter-term liquidity, higher (100-200) identify major swings
Max Liquidity Age (bars) – Default: 100, Range: 20-500, removes liquidity lines older than specified bars, adjust based on timeframe
Liquidity Sensitivity – Default: 0.5, Range: 0.1-1.0, controls pivot detection sensitivity, lower values mark only major swings, higher values identify minor swings
Max Liquidity Zones to Display – Default: 3, Range: 1-10, limits total liquidity levels shown maintaining chart clarity
Market Structure Settings
Pivot Length – Default: 5, Range: 3-15, defines bars to left/right for pivot validation, lower values (3-5) create sensitive structure breaks, higher (10-15) filter for major shifts
Min Structure Move (%) – Default: 1.0, Range: 0.1-5.0, sets minimum percentage move required between pivots to confirm structure change
Multi-Timeframe Settings
Enable MTF Analysis – Default: On, activates higher timeframe trend analysis incorporation into Smart Money Score
Higher Timeframe Multiplier – Default: 4, Range: 2-10, multiplies current timeframe to determine analysis timeframe (4x on 15min = 1hour)
Visual Settings
Bullish Color – Default: Green (#089981), sets color for bullish Order Blocks, FVGs, and structure elements
Bearish Color – Default: Red (#f23645), defines color for bearish elements
Neutral Color – Default: Gray (#787b86), controls color of mitigated zones and neutral elements
Show Educational Labels – Default: On, displays text labels on zones identifying type (OB, FVG, BOS), disable once familiar with patterns
Order Block Transparency – Default: 92, Range: 80-98, controls Order Block box transparency
FVG Transparency – Default: 92, Range: 80-98, sets Fair Value Gap zone transparency independently from Order Blocks
Alert Settings
Alert on Order Block Formation – Default: On, triggers notification when new volume-validated Order Block detected
Alert on FVG Formation – Default: On, sends alert when Fair Value Gap appears enabling quick response to imbalances
Alert on Break of Structure – Default: On, notifies when BOS or CHoCH confirmed
Alert on High Smart Money Score – Default: On, alerts when Smart Money Score crosses above 70 threshold indicating high-probability setup
✅Best Use Cases
Order Block Retest Entries – After Break of Structure, wait for price retrace into fresh bullish Order Block with Smart Money Score >70, enter long on zone reaction targeting next liquidity level
Fair Value Gap Retracement Trading – When price creates FVG during strong move then retraces, enter as price approaches unfilled gap expecting institutional orders to continue trend
Liquidity Sweep Reversals – Monitor price approaching swing high/low liquidity zones against prevailing Smart Money Score trend, after stop hunt sweep watch for rejection into premium Order Block/FVG
Multi-Timeframe Confluence Setups – Identify alignment when current timeframe Order Block coincides with higher timeframe FVG plus MTF analysis showing matching trend bias
Break of Structure Continuations – After BOS confirms trend direction, trade pullbacks to nearest Order Block or FVG in direction of structure break using Smart Money Score >70 as entry filter
Change of Character Reversal Plays – When CHoCH detected indicating potential reversal, look for Smart Money Score pivot with opposing Order Block formation then enter on structure confirmation
⚠️Limitations
Lagging Pivot Calculations – Pivot-based features (Liquidity Zones, Market Structure) require bars to right of pivot for confirmation, meaning these elements identify levels retrospectively with delay equal to lookback period
Whipsaw in Ranging Markets – During choppy conditions, Order Blocks fail frequently and structure breaks produce false signals as Smart Money Score fluctuates without clear institutional bias, best used in trending markets
Volume Data Dependency – Order Block volume validation requires accurate volume data which may be incomplete on Forex pairs or limited in crypto exchange feeds
Subjectivity in Scoring Weights – Proprietary 25-20-20-20-15 weighting reflects general institutional behavior but may not optimize for specific instruments or market regimes, user cannot adjust factor weights
Visual Complexity on Lower Timeframes – Sub-hour timeframes generate excessive zones creating cluttered charts, requires aggressive display limit reduction and higher minimum thresholds
No Fundamental Integration – Indicator analyzes purely technical price action and volume without incorporating economic events, news catalysts, or fundamental shifts that override technical levels
💡What Makes This Unique
Unified SMC Ecosystem – Unlike indicators displaying Order Blocks OR FVGs OR Liquidity separately, SMFI combines all three institutional concepts plus market structure into single cohesive system
Proprietary Confidence Scoring – Rather than manual setup assessment, automated Smart Money Score quantifies probability by weighting five institutional dimensions into actionable 0-100 rating
Volume-Filtered Quality – Eliminates weak Order Blocks forming without institutional volume confirmation, ensuring displayed zones represent genuine accumulation/distribution
Adaptive Lifecycle Management – Automatically updates mitigation status and removes aged zones preventing trades on dead levels through continuous validity and age monitoring
Educational Integration – Built-in tooltips, labeled zones, and reference panel make indicator functional for both learning Smart Money Concepts and executing strategies
🔬How It Works
Order Block Detection – Scans for patterns where strong directional move follows counter-move creating last down-candle before rally (bullish OB) or last up-candle before sell-off (bearish OB), validates formations only when candle exhibits volume exceeding configurable multiple (default 1.5x) of 20-bar average volume
Fair Value Gap Identification – Compares current candle’s high/low against two-candles-prior low/high to detect price imbalances, calculates gap size as percentage of close and filters micro-gaps below minimum threshold (default 0.3%), monitors whether subsequent price fills 50% triggering mitigation status
Liquidity Zone Mapping – Employs pivot detection using configurable lookback (default 50 bars) to identify swing highs/lows where retail stops cluster, extends horizontal reference lines from pivot creation and applies age-based filtering to remove stale zones
Market Structure Analysis – Tracks pivot progression using structure-specific lookback (default 5 bars) to determine trend, confirms uptrend when new pivot high exceeds previous by minimum move percentage, detects Break of Structure when price breaks recent pivot level, flags Change of Character for potential reversals
Multi-Timeframe Confluence – When enabled, requests security data from higher timeframe (current TF × HTF multiplier, default 4x), compares HTF close against HTF 20-period MA to determine bias, contributes ±50 points to score ensuring alignment with institutional positioning on superior timeframe
Smart Money Score Calculation – Evaluates Order Block component via ATR-normalized distance producing max 100-point contribution weighted at 25%, assesses FVG factor through age penalty and distance at 20% weight, calculates Liquidity proximity at 20%, incorporates structure bias (±50-100 points) at 20%, adds MTF component at 15%, applies 3-period smoothing to reduce volatility
Visual Rendering and Lifecycle – Draws Order Block boxes, Fair Value Gap rectangles with color coding (green/red active, gray mitigated), extends liquidity dashed lines with fade-by-age opacity, plots BOS labels, displays Smart Money Score dashboard, continuously updates checking mitigation conditions and removing elements exceeding age/display limits
💡Note:
The Smart Money Flow Index combines multiple Smart Money Concepts into unified institutional order flow analysis. For optimal results, use the Smart Money Score as confluence filter rather than standalone entry signal – scores above 70 indicate high-probability setups but should be combined with risk management, higher timeframe bias, and market regime understanding.

ICT Killzones Toolkit [LuxAlgo]The ICT Killzones Toolkit is a comprehensive set of tools designed to assist traders in identifying key trading zones and patterns within the market.
The ICT Killzones Toolkit includes the following Price Action components:
ICT Killzones with Pivot Highs/Lows
Order Blocks
Breaker Blocks
Fair Value Gaps
Market Structure Shifts
By combining these components, the ICT Killzones Toolkit provides traders with a comprehensive framework for analyzing the market and identifying setups of interest. Leveraging these tools effectively can enhance traders' decision-making process and improve killzones interpretability.
🔶 USAGE
In forex/futures trading, timing is crucial. ICT Killzone are specific periods when there's a higher chance of finding setups of interest. Mastering these time intervals can offer significant advantages to traders who know how to use them effectively.
The image above highlights a potential setup of interest when using the ICT Killzones Toolkit.
As another example for utilizing the ICT Killzones Toolkit, we can see in the image above when price retests setups generated from killzones such as Order Blocks or Fair Value Gaps, a potential strategy could be to look for entries on those & take profits as the next killzone appears.
🔹 Order Blocks
Order Blocks are sections on a price chart where notable buying or selling activity has occured, often signaling interest zones for institutional traders. This toolkit's Order Blocks component pinpoints these areas within the Killzone, which may act as potential support or resistance levels.
🔹 Breaker Blocks
Breaker Blocks are zones built from mitigated order blocks, and highlight zones on the chart where price has previously stalled or reversed. These areas may act as significant barriers to price movement in the future, and the Breaker Blocks component helps traders identify them for potential trading opportunities.
🔹 Fair Value Gaps
Fair value gaps are especially favored by price action traders and arise from market inefficiencies or imbalances, typically when buying and selling are unequal. These gaps often attract price movement before resuming in the same direction. the Fair Value Gaps component of the toolkit helps traders identify and analyze them.
🔹 Market Structure Shifts
Market Structure Shifts refer to significant changes in the overall structure of the market, such as shifts in trend direction, volatility, or trading activity. These shifts can provide valuable insights into market sentiment and potential trading opportunities, and the Market Structure Shifts component helps traders identify and interpret them.
Overall, the ICT Killzone Toolkit combines these components to provide traders with a comprehensive framework for analyzing the markets and identifying high-probability trading setups.
🔶 SETTINGS
🔹 ICT Killzones
Asian, London Open, New York, and London Close: toggles the visibility of specific Killzones, allowing users to customize time periods and Killzone colors.
Killzone Lines : Top/Bottom, Mean and Extend Top/Bottom: toggles the visibility of the Killzone's pivot high and low lines, mean (average) line, and allows users to extend the pivot lines.
Killzone Labels: Toggles the visibility of the Killzone labels.
Display Killzones within Timeframes Up To: Toggles the visibility of the Killzones up to selected Timeframes.
Open Price, Separator, Label, and Color: toggles the visibility of the open price of the Killzones or for the day, week, or month. If the day, week, or month is selected, a separator will be displayed to highlight the beginning of each respective period. Additionally, users can customize the color and toggle the label as needed.
🔹 Order Blocks & Breaker Blocks
Order Blocks | Breaker Blocks: toggles the visibility of the order blocks & breaker blocks.
Swing Detection Length: lookback period used for the detection of the swing points used to create order blocks & breaker blocks.
Mitigation Price: allows users to select between closing price or wick of the candle.
Use Candle Body in Detection: allows users to use candle bodies as order block areas instead of the full candle range.
Remove Mitigated Order Blocks & Breaker Blocks: toggles the visibility of the mitigated order blocks & breaker blocks.
Extend Order Blocks & Breaker Blocks: enables processing of the order blocks & breaker blocks beyond the boundaries of the killzones.
Display Order Blocks & Breaker Blocks: enables the display of the first, last, or all occurrences of the order blocks & breaker blocks.
Order Blocks : Bullish, Bearish Color: color customization option for order blocks.
Breaker Blocks : Bullish, Bearish Color: color customization option for breaker blocks.
Show Order Blocks & Breaker Blocks Text: toggles the visibility of the order blocks & breaker blocks labels.
🔹 Market Structure Shifts
Market Structure Shifts: toggles the visibility of the market structure shifts.
Detection Length: market structure shift detection length.
Display Market Structure Shifts: enables the display of the first, last, or all occurrences of the market structure shifts.
Market Structure Shifts : Bullish, Bearish Color: color custumization option for market structure shifts.
Show Market Structure Shifts Text: toggles the visibility of the market structure shifts labels.
🔹 Fair Value Gaps
Fair Value Gaps: toggles the visibility of the fair value gaps.
Fair Value Gap Width Filter: filtering threshold wile detecting fair value gaps.
Remove Mitigated Fair Value Gaps: removes mitigated fair value gaps.
Extend Fair Value Gaps: enables processing of the fair value gaps beyond the boundaries of the killzones.
Display Fair Value Gaps: enables the display of the first, last, or all occurrences of the fair value gaps.
Bullish Imbalance Color: color customization option.
Bearish Imbalance Color: color customization option.
Show Fair Value Gaps Text: toggles the visibility of the fair value gaps labels.
🔶 RELATED SCRIPTS
Smart-Money-Concepts
Order-Blocks-Breaker-Blocks
Thanks to our community for recommending this script. For more conceptual scripts and related content, we welcome you to explore by visiting >>> LuxAlgo-Scripts .

SMC Liquidity Engine Pro SMC Liquidity Engine Pro - Complete Trading Guide & Documentation
📊 Introduction: Understanding Smart Money Concepts
The SMC Liquidity Engine Pro is a comprehensive, institutional-grade trading indicator that brings professional Smart Money Concepts (SMC) methodology directly to your TradingView charts. This isn't just another technical indicator—it's a complete framework for understanding how institutional traders, market makers, banks, and hedge funds manipulate and move the markets.
What Makes This Different?
While most retail traders rely on lagging indicators like moving averages or RSI, this indicator reveals the real-time footprints of institutional activity. It shows you:
Where large players are accumulating or distributing positions
How they engineer liquidity to trigger retail stop losses
When they're shifting from one directional bias to another
Where price inefficiencies exist that institutions will likely revisit
The markets don't move randomly—they move based on liquidity. Understanding this fundamental truth is what separates consistently profitable traders from those who struggle. This indicator decodes that liquidity-driven behavior and presents it in clear, actionable visual signals.
The Philosophy Behind Smart Money Concepts
Smart Money Concepts is built on several core principles:
1. Liquidity is King: Price doesn't move because of patterns or indicators—it moves to collect liquidity (stop losses and pending orders). Institutions need massive liquidity to fill their large positions, so they engineer price movements to create that liquidity before making their real directional move.
2. Market Structure Reveals Intent: The way price forms highs and lows tells a story about who's in control. When structure breaks, it signals a shift in institutional positioning.
3. Inefficiencies Get Filled: When price moves too quickly in one direction, it leaves behind "fair value gaps"—areas of imbalance. Institutions frequently return to these areas to fill orders and restore balance.
4. Manipulation Precedes True Moves: The most explosive directional moves are often preceded by liquidity sweeps in the opposite direction—trapping retail traders before the real move begins.
This indicator automates the identification of all these concepts, allowing you to trade alongside the smart money rather than being their exit liquidity.
🎯 Core Features - Deep Dive
1. Market Structure Detection & Visualization
What It Is: Market structure forms the foundation of all Smart Money analysis. This indicator automatically identifies and tracks swing highs and swing lows using a sophisticated pivot detection algorithm. These aren't just any price points—they represent areas where the market showed a significant shift in supply and demand dynamics.
How It Works: The indicator uses a customizable lookback period to identify valid swing points. A swing high must have lower highs on both sides within the lookback period, and a swing low must have higher lows on both sides. This ensures that only significant structural points are marked, filtering out minor noise and consolidation.
Visual Presentation:
Bullish Structure (Cyan Lines): Horizontal lines extending from each identified swing high, showing resistance levels that price previously respected
Bearish Structure (Red Lines): Horizontal lines extending from each identified swing low, showing support levels where buying pressure emerged
Trading Application: These structure levels serve multiple purposes:
Target Zones: Previous highs become targets in uptrends; previous lows become targets in downtrends
Invalidation Levels: If expecting a bullish move, breaking below the last swing low invalidates the setup
Context for Other Signals: All BOS, CHOCH, and liquidity sweep signals gain meaning from their relationship to structure
Multi-Timeframe Anchors: Higher timeframe structure provides context for lower timeframe entries
Advanced Tip: When multiple timeframe structures align (e.g., a daily swing low coincides with a 4-hour swing low), these levels carry significantly more weight and are more likely to be defended or, when broken, lead to explosive moves.
2. Break of Structure (BOS) - Trend Confirmation
What It Is: A Break of Structure occurs when price definitively closes beyond a previous swing high (bullish BOS) or swing low (bearish BOS). This signals that the current trend maintains its momentum and is likely to continue in the same direction.
The Institutional Perspective: When institutions want to continue pushing price in a direction, they need to break through previous resistance or support. A clean BOS indicates that:
There's sufficient institutional buying/selling to overcome the supply/demand at previous structure
The trend has enough momentum to attract more participants
Stop losses above/below structure have been triggered, providing liquidity for continuation
Signal Characteristics:
Bullish BOS Label: Appears below the bar that closes above the previous swing high
Bearish BOS Label: Appears above the bar that closes below the previous swing low
Confirmation: Requires a full candle close, preventing false signals from wicks
Trading Strategies:
Trend Continuation Entries: After a BOS, wait for a pullback to a Fair Value Gap or minor structure, then enter in the direction of the break
Breakout Trading: Enter immediately on BOS confirmation with a stop below the broken structure
Momentum Confirmation: Use BOS to confirm that your existing position is aligned with institutional flow
Scaling Strategy: Add to positions on each successive BOS in trending markets
What to Watch For:
Volume: Strong BOS movements should be accompanied by above-average volume
Speed: Rapid price movement through structure suggests institutional urgency
Follow-Through: The best BOS signals see price continue strongly without immediately reversing
Higher Timeframe Alignment: BOS on higher timeframes (4H, Daily) carry more weight than lower timeframe breaks
Common Pitfalls:
Not all structure breaks are equal—BOS during ranging markets are less reliable
A BOS immediately followed by a reversal back into the range may indicate a failed breakout
During major news events, structure can be broken temporarily without institutional intent
3. Liquidity Sweep Detection - Spotting Manipulation
What It Is: Liquidity sweeps (also called "stop hunts" or "liquidity grabs") occur when price temporarily breaks beyond a key level to trigger stop losses and pending orders, then immediately reverses back. This is one of the most important concepts in SMC trading because it reveals intentional manipulation.
Why Institutions Do This: Large institutional orders can't be filled at a single price point—they need massive liquidity. The biggest pools of liquidity sit just beyond obvious highs and lows where retail traders place their stops. By briefly pushing price into these zones, institutions:
Trigger retail stop losses (creating market orders)
Activate pending buy/sell orders
Fill their large positions at favorable prices
Trap late breakout traders before reversing
Detection Methodology: The indicator identifies sweeps using multiple criteria:
Price must penetrate beyond the structural high/low (creating the sweep)
The candle must close back on the opposite side of the structure (confirming rejection)
The sweep distance is measured against ATR to distinguish manipulation from normal volatility
The sweep multiplier setting allows you to adjust sensitivity based on market conditions
Visual Indicators:
Orange Down Arrows: Mark liquidity sweeps above structural highs
Lime Up Arrows: Mark liquidity sweeps below structural lows
Liquidity Zone Boxes: Semi-transparent colored boxes highlight the exact range of the swept area
Persistent Display: Zones remain visible for several bars to maintain context
Trading Applications:
Reversal Trading: Liquidity sweeps often mark excellent reversal points. After a sweep:
Wait for the sweep to complete (candle closes back inside structure)
Look for a Change of Character signal for confirmation
Enter in the direction opposite to the sweep
Place stops beyond the sweep high/low
Target the opposite side of the range or next structural level
Continuation Filtering: Not all sweeps lead to reversals. During strong trends:
Sweeps of minor structure in a trending market often precede continuation
Use higher timeframe structure to determine if a sweep is counter-trend (likely reversal) or with-trend (likely continuation)
Entry Refinement: In ranging markets, trade from swept lows to highs and vice versa, as institutions accumulate at the extremes.
Advanced Sweep Analysis:
Double Sweeps: When both sides of a range are swept, expect a strong breakout
Sweep Rejection Quality: Fast, strong rejections of sweeps are more reliable than slow grinding returns
Timeframe Consideration: Daily timeframe sweeps are significantly more important than 15-minute sweeps
Volume Profile: Sweeps with low volume followed by high volume reversals confirm manipulation
What Makes a High-Quality Sweep Signal: ✅ Penetrates structure by at least 0.5-1x ATR
✅ Strong rejection candle (long wick, decisive close)
✅ Occurs at a higher timeframe structural level
✅ Creates a Change of Character on the following move
✅ Sweeps an obvious level where retail stops cluster
4. Change of Character (CHOCH) - Major Reversal Signals
What It Is: A Change of Character represents the most significant shift in market dynamics—when the entire structural bias of the market flips from bullish to bearish or bearish to bullish. CHOCH signals are the crown jewel of SMC trading because they identify the exact moment when institutional positioning fundamentally changes.
The Anatomy of a CHOCH: A valid CHOCH requires a specific sequence:
Established Trend: A clear directional bias with multiple BOS in one direction
Liquidity Engineering: A sweep of structure in the current trend direction (the manipulation phase)
Structural Break: Price then breaks structure in the OPPOSITE direction (the revelation phase)
This combination shows that institutions have:
Completed their accumulation/distribution at favorable prices (via the sweep)
Shifted their positioning from bullish to bearish (or vice versa)
Begun a new directional campaign
Visual Presentation:
Bullish CHOCH (Cyan Triangle Up): Appears when bearish structure is broken after a low sweep, signaling the shift to bullish control
Bearish CHOCH (Red Triangle Down): Appears when bullish structure is broken after a high sweep, signaling the shift to bearish control
Prominent Markers: Larger and more visually distinct than BOS signals, reflecting their importance
Why CHOCH Signals Are So Powerful:
Trend Reversal Identification: They mark the earliest possible confirmation of a trend change
High Win Rate: When combined with proper risk management, CHOCH signals have among the highest success rates in SMC trading
Risk-Reward Ratio: Entering at CHOCH gives you the best possible risk-reward since you're entering at the beginning of a new trend
Institutional Confirmation: The sequence of sweep + structure break proves institutional repositioning, not just retail sentiment
Trading CHOCH Signals:
The Perfect CHOCH Setup:
Identify the Sweep: Watch for a liquidity sweep of structural lows (for bullish) or highs (for bearish)
Wait for the Break: Don't enter on the sweep—wait for structure to break in the opposite direction
CHOCH Confirmation: The indicator fires the CHOCH signal—this is your entry trigger
Entry Execution:
Aggressive: Enter immediately on CHOCH confirmation
Conservative: Wait for a pullback to the first Fair Value Gap or broken structure (now turned support/resistance)
Stop Placement: Beyond the swept liquidity point
Target Selection: Previous swing in the opposite direction, or let it run to the next CHOCH
Multiple Timeframe CHOCH Strategy: The most powerful setups occur when CHOCHs align across timeframes:
Daily CHOCH: Signals major institutional trend change, target 500+ pips (Forex) or significant point moves
4H CHOCH: Confirms daily direction, provides swing trade opportunities
1H CHOCH: Offers precise entry timing within the higher timeframe trend
15M CHOCH: Used for position scaling and intraday management
Example Trade Flow:
Daily Chart: Bullish CHOCH appears after weeks of downtrend
↓
4H Chart: Wait for pullback after the daily CHOCH, then catch the 4H bullish CHOCH
↓
1H Chart: Enter on the 1H bullish CHOCH that aligns with both higher timeframes
↓
Result: You've entered at the beginning of a major trend with multiple confirmations
CHOCH Quality Grading:
A-Grade CHOCH (Highest Probability):
Occurs at major higher timeframe structure
Following a clear liquidity sweep
Volume spike on the structural break
Multiple timeframe alignment
Creates a large Fair Value Gap on the break
B-Grade CHOCH (Good Probability):
Valid sweep and structure break
Single timeframe signal
Moderate volume
Occurs at minor structure
C-Grade CHOCH (Lower Probability):
Choppy, ranging market context
Weak sweep or unclear structure
Counter to higher timeframe trend
Low volume confirmation
Common Mistakes with CHOCH Trading: ❌ Entering on the sweep instead of waiting for the structure break
❌ Ignoring higher timeframe context
❌ Taking every CHOCH regardless of quality
❌ Not waiting for pullbacks on aggressive trends
❌ Placing stops too tight, getting caught in volatility
Advanced CHOCH Concepts:
Failed CHOCH: Occasionally, what appears to be a CHOCH will fail (price reverses back into the previous trend). This often indicates:
Insufficient institutional conviction for the reversal
Fake-out to grab liquidity in the opposite direction
Need to wait for a higher timeframe CHOCH for confirmation
When a CHOCH fails, it often sets up an even stronger continuation of the original trend.
CHOCH vs BOS Decision Matrix:
If in doubt about trend direction → wait for CHOCH
If confident in trend → trade BOS continuations
After a CHOCH → next signals in the new direction are BOS
5. Fair Value Gaps (FVG) - Institutional Retracement Zones
What It Is: Fair Value Gaps represent price imbalances where the market moved so quickly that it left behind inefficient pricing. These gaps form when there's no overlap between the current candle's wick and the candle from two bars ago—a void in the price action that creates a "gap" in the order flow.
The Institutional Logic: When institutions execute large market orders, they can push price rapidly through levels without allowing normal two-way trading. This creates unfilled orders and imbalanced order books. Institutions often return to these gaps to:
Fill additional orders at more favorable prices
Allow the market to "breathe" before the next push
Create support/resistance at the gap for the next move
Restore balance to the order book
FVG Formation Criteria: This indicator uses enhanced FVG detection logic:
Bullish FVG (Upward Gap):
Current candle's low is above the high from 2 candles ago
Creates a visible gap where no trading occurred
Gap size must exceed 30% of ATR (filtering minor gaps)
Typically forms on strong bullish momentum candles
Market moved up so fast it left unfilled sell orders
Bearish FVG (Downward Gap):
Current candle's high is below the low from 2 candles ago
Creates a visible gap where no trading occurred
Gap size must exceed 30% of ATR
Typically forms on strong bearish momentum candles
Market moved down so fast it left unfilled buy orders
Visual Presentation:
Bullish FVG Zones: Semi-transparent cyan boxes extending from gap bottom to top
Bearish FVG Zones: Semi-transparent red boxes extending from gap top to bottom
Dynamic Management: Gaps automatically removed when filled or expired
Clean Display: Only active, unfilled gaps shown to prevent chart clutter
FVG Trading Strategies:
Strategy 1: FVG Retracement Entries After a CHOCH or strong BOS, wait for price to retrace into the FVG for entry:
Identify trend direction via CHOCH or BOS
Locate the nearest FVG in the direction of the trend
Set limit orders within the FVG zone
Stop loss beyond the FVG
Target the next structural level or previous swing
Strategy 2: FVG Breakout Confirmation When price breaks through an FVG without filling it:
Signals extreme institutional urgency
Indicates the move is likely to continue strongly
The unfilled gap becomes a "no-go zone" for counter-trend entries
Strategy 3: Multiple FVG Management When multiple FVGs form in sequence:
The first FVG is most likely to be filled
If price skips the first FVG, it signals exceptional strength
Sequential gaps create a "gap ladder" for scaling into positions
FVG Quality Assessment:
High-Quality FVGs (Best Trading Zones):
Large gap size (1.5x+ ATR)
Formed on high volume impulse moves
Aligned with higher timeframe structure
Created during CHOCH or strong BOS
Positioned between current price and key structure
Low-Quality FVGs (Use Caution):
Small gaps (< 0.5 ATR)
Formed during choppy, ranging conditions
Multiple overlapping gaps in the same area
Counter to higher timeframe trend
Very old gaps (50+ bars ago)
FVG Lifecycle Management:
The indicator intelligently manages FVG zones:
Gap Filling:
Bullish FVG is "filled" when price touches the bottom of the gap
Bearish FVG is "filled" when price touches the top of the gap
Filled gaps are automatically removed from the chart
Partial fills count as complete fills (institutions got their orders)
Gap Expiration:
Gaps older than the extension period (default 10 bars) are removed
This keeps the chart clean and focuses on relevant levels
Adjustable from 5-50 bars based on timeframe and trading style
Gap Priority: When multiple gaps exist, closest gap to current price is most relevant
Advanced FVG Concepts:
Nested FVGs: Sometimes FVGs form within larger FVGs. The smaller, more recent gap typically gets filled first, providing a secondary entry within the larger gap.
FVG Clusters: When 3+ FVGs stack in the same zone, this area becomes a major institutional reaccumulation zone—excellent for swing entries.
Inverted FVGs: Bullish FVGs in downtrends or bearish FVGs in uptrends can act as resistance/support where rallies/dips fail.
FVG + Liquidity Sweep Combination: The ultimate entry setup:
Liquidity sweep occurs
CHOCH confirms reversal
Price retraces into FVG created during the CHOCH move
Enter with exceptional risk-reward ratio
FVG Statistics & Probabilities:
Research on FVG behavior shows:
Approximately 70% of FVGs get filled within 20 bars
FVGs formed during CHOCH have 80%+ fill rate
Larger gaps (2x+ ATR) have lower but higher-quality fill rates
Higher timeframe FVGs are more magnetic than lower timeframe
Timeframe Considerations:
Daily FVGs:
Can remain unfilled for weeks
Major institutional zones
Often mark the absolute best entry prices for swing trades
When filled, usually result in strong reactions
4H FVGs:
Typically fill within 3-7 days
Excellent for swing trading
Balance between frequency and reliability
1H FVGs:
Usually fill within 1-3 days
Good for short-term position trading
More frequent signals
15M FVGs:
Often fill same day
Best used for intraday refinement
Should align with higher timeframe gaps
🔧 Customization & Settings Guide
Structure Detection Settings
Swing Lookback Period (3-50 bars): This is arguably the most important setting as it determines what the indicator considers "structure."
Low Values (3-7):
Identifies minor swings and frequent structure points
More BOS and CHOCH signals
Better for scalping and day trading
Risk: More false signals in choppy markets
Best for: 15M-1H charts, active traders
Medium Values (8-15):
Balanced approach capturing meaningful swings
Default setting works well for most traders
Good signal-to-noise ratio
Best for: 1H-4H charts, swing traders
High Values (16-50):
Only major structural points identified
Fewer but higher-quality signals
Cleaner charts with less noise
Better for trending markets
Best for: 4H-Daily charts, position traders
ATR Period (1-50): Controls how volatility is measured for liquidity sweep detection.
Shorter Periods (7-14):
More responsive to recent volatility changes
Better during high volatility events
May overreact to short-term spikes
Longer Periods (15-30):
Smoother, more stable volatility measurement
Better for swing trading
Reduces sensitivity to short-term noise
Liquidity Sweep Multiplier (0.5-3.0): Determines how far beyond structure price must move to qualify as a sweep.
Low Multiplier (0.5-0.9):
Catches smaller, more frequent sweeps
More signals but lower reliability
Good for scalping or high-frequency trading
Use in ranging markets
Medium Multiplier (1.0-1.5):
Balanced sensitivity
Default 1.2 works for most situations
Good signal quality
High Multiplier (1.6-3.0):
Only major, obvious sweeps detected
Fewer but very high-quality signals
Best for trending markets
Use when you want only the clearest setups
Display Options
Toggle Controls: Each component can be individually enabled/disabled:
Show Market Structure:
Turn off when chart becomes too cluttered
Essential for understanding context, generally keep ON
Disable only when you know structure from higher timeframe
Show Liquidity Zones:
Highlights swept areas with boxes
Can be disabled if you prefer cleaner charts
Keep ON when learning to spot manipulation
Show Break of Structure:
BOS labels can be disabled if trading only reversals
Keep ON for trend following strategies
Show Change of Character:
Core SMC signal, usually keep ON
Only disable if focusing purely on continuation trading
Show Fair Value Gaps:
OFF by default to prevent overwhelming new users
Turn ON once comfortable with basic structure
Can generate many zones on lower timeframes
FVG Extension Period (5-50 bars): Determines how long unfilled gaps remain displayed.
Short Extension (5-10):
Keeps charts very clean
Only shows very recent gaps
Good for day trading
May remove gaps before they fill
Medium Extension (11-25):
Balanced approach
Captures most gap fills
Good for swing trading
Long Extension (26-50):
Shows historical gap context
Better for position trading
Higher timeframe analysis
Can make charts busy on lower timeframes
Color Scheme Customization
Why Colors Matter: Visual clarity is crucial for quick decision-making. The color scheme should:
Clearly distinguish bullish vs bearish elements
Work well with your chart background (dark/light mode)
Be visible but not distracting
Match your personal preference for aesthetics
Default Colors:
Bullish: Cyan (
#00ffff) - visibility and association with "cool" buying
Bearish: Red (
#ff0051) - visibility and universal danger/selling association
FVG Bullish: 85% transparent cyan - visible but not overpowering
FVG Bearish: 85% transparent red - visible but not overpowering
Customization Tips:
Increase transparency if zones overwhelm price action
Use higher contrast colors on light backgrounds
Keep bullish/bearish colors visually distinct
Test colors across different market conditions
Optimization by Market Type
Forex (24-hour markets):
Structure Lookback: 10-15
ATR Period: 14-21
Sweep Multiplier: 1.0-1.5
Best Timeframes: 15M, 1H, 4H
Stocks (Session-based):
Structure Lookback: 8-12
ATR Period: 14
Sweep Multiplier: 1.2-1.8
Best Timeframes: 5M, 15M, 1H, Daily
Note: Gaps at market open/close aren't FVGs
Cryptocurrency (High volatility):
Structure Lookback: 12-20 (filter noise)
ATR Period: 10-14 (responsive to volatility)
Sweep Multiplier: 1.5-2.5 (larger sweeps)
Best Timeframes: 15M, 1H, 4H
Indices (Moderate volatility):
Structure Lookback: 10-15
ATR Period: 14-20
Sweep Multiplier: 1.0-1.5
Best Timeframes: 1H, 4H, Daily
📈 Complete Trading System & Strategies
The Complete SMC Trading Process
Step 1: Higher Timeframe Analysis (Daily/4H) Begin every trading session by analyzing higher timeframes:
Identify the prevailing market structure (bullish or bearish)
Mark key swing highs and lows
Note any recent CHOCHs that signal trend changes
Identify major Fair Value Gaps that could act as targets or entry zones
Determine areas of liquidity (obvious highs/lows where stops cluster)
Step 2: Trading Timeframe Setup (1H/4H) Move to your primary trading timeframe:
Wait for alignment with higher timeframe bias
Look for CHOCH signals if expecting reversal
Look for BOS signals if expecting continuation
Identify liquidity sweeps that create trading opportunities
Note nearby FVGs for entry refinement
Step 3: Entry Timeframe Execution (15M/1H) Use lower timeframe for precise entry:
After higher timeframe signal, wait for lower timeframe confirmation
Enter on FVG fills, structure breaks, or CHOCH signals
Place stop beyond swept liquidity or broken structure
Set targets at next structure level or opposite side of range
Step 4: Management Active trade management increases profitability:
Move stop to breakeven after price moves 1R (risk unit)
Take partial profits at first target (structure level)
Let remainder run to major targets
Trail stop using FVGs or structure breaks in your direction
Exit if a counter-trend CHOCH appears
High-Probability Trading Setups
Setup 1: The Classic CHOCH Reversal
Market Context:
Extended trend in one direction
Price reaching obvious highs/lows where liquidity pools
Setup Requirements:
Liquidity sweep of the high/low
CHOCH signal fires
(Optional) Wait for pullback to FVG
Entry: On CHOCH confirmation or FVG fill
Stop: Beyond swept liquidity
Target: Previous swing in opposite direction
Example (Bullish):
Market in downtrend for 2 weeks
Price sweeps below obvious daily low
Bullish CHOCH fires (breaks previous lower high)
Enter immediately or wait for pullback to bullish FVG
Stop below swept low
Target: Previous lower high, then previous high
Risk-Reward: Typically 1:3 to 1:5+
Setup 2: BOS Continuation with FVG Entry
Market Context:
Established trend with recent CHOCH
Strong momentum in trend direction
Setup Requirements:
Recent CHOCH established trend direction
BOS signal confirms continuation
Wait for pullback into FVG created on the BOS move
Entry: Limit order within FVG zone
Stop: Beyond FVG (invalid if exceeded)
Target: Next structural level
Example (Bearish):
Bearish CHOCH 2 days ago
Price makes BOS breaking new low
Large bearish FVG created during the break
Price retraces into FVG zone
Enter short at FVG fill
Stop above FVG
Target: Next major low or daily FVG below
Risk-Reward: 1:2 to 1:4
Setup 3: Liquidity Sweep Fade
Market Context:
Ranging market between defined highs/lows
Obvious liquidity on both sides of range
Setup Requirements:
Clear range established (minimum 20-30 bars)
Price sweeps one side of range (high or low)
Strong rejection back into range
Entry: After sweep rejection confirmed
Stop: Beyond swept level
Target: Opposite side of range
Example:
Range between 1.0850-1.0920 (EUR/USD)
Price sweeps above 1.0920 to 1.0935
Strong bearish rejection candle back below 1.0920
Enter short at 1.0915
Stop at 1.0940 (above sweep high)
Target: 1.0850 (range low)
Risk-Reward: 1:2.6
Setup 4: Multi-Timeframe CHOCH Alignment
Market Context:
Major trend change occurring
Multiple timeframes showing reversal signals
Setup Requirements:
Daily timeframe shows CHOCH
Wait for 4H CHOCH in same direction
Enter on 1H CHOCH that aligns
Entry: 1H CHOCH confirmation
Stop: Below 4H structure
Target: Daily structural level
Example (Bullish):
Daily bearish trend for months
Daily bullish CHOCH appears
4H shows bullish CHOCH next day
1H bullish CHOCH provides entry
Enter long on 1H signal
Stop: Below 4H swing low
Target: Daily previous high
Risk-Reward: 1:5 to 1:10+
Position: Larger size due to alignment
Setup 5: Failed CHOCH Continuation
Market Context:
Strong trend temporarily looks like reversing
"False" CHOCH creates trap for counter-trend traders
Setup Requirements:
Apparent CHOCH against main trend
Price fails to follow through
Original trend resumes with strong BOS
Entry: On BOS in original trend direction
Stop: Recent swing
Target: Extension of original trend
Example:
Strong daily uptrend
Bearish CHOCH appears (potential reversal)
Price consolidates but doesn't follow through down
Bullish BOS breaks above recent consolidation
Enter long on BOS
Stop: Below failed CHOCH low
Target: New high extension
Risk-Reward: 1:3 to 1:6
Note: Failed reversals often lead to explosive continuations
Risk Management Framework
Position Sizing: Never risk more than 1-2% of account per trade, even on A+ setups.
Risk Calculation:
Position Size = (Account Size × Risk %) / (Entry - Stop Loss in pips/points)
Example:
Account: $10,000
Risk: 1% = $100
Entry: 1.0900
Stop: 1.0870 (30 pips)
Position Size: $100 / 30 pips = $3.33 per pip
Lot Size (Forex): 0.33 lots
Stop Loss Placement:
For CHOCH Reversals:
Place stop 5-10 pips beyond swept liquidity
Gives room for volatility while protecting capital
If swept liquidity is violated, setup is invalidated
For BOS Continuations:
Place stop beyond the FVG or structure that provided entry
Typically tighter stops (closer to entry)
Can trail stop to breakeven quickly
For Range Trading:
Stop beyond the swept level
Generally tight stops work well in ranges
Exit quickly if range boundaries break
Take Profit Strategy:
Scaling Out Method (Recommended):
First Target (50% of position): First structural level (1:1 to 1:2)
Second Target (30% of position): Major structure (1:3 to 1:5)
Trail Stop (20% of position): Let run to full extension
Full Exit Method:
Hold entire position to predetermined target
Requires more discipline
Higher reward but also higher risk of giveback
Trade Management Rules:
Breakeven Rule: Move stop to breakeven after 1R profit
Partial Profit Rule: Take partials at structure levels
Trailing Rule: Trail stop

Order-Block Detector ICT/SMT + FVG + SignalsOrderBlock-Finder
This script shows order-blocks (OB) and fair-value-gaps (FVG). Additionaly there are entry signals for OB and FVG. The Dist-Parameter tell how many candles should exist between the beginning of the OB or FVG and the pullback.
Order-Blocks
An order block in trading typically refers to a significant grouping of buy or sell orders at a particular price level within a financial market. These blocks of orders can influence price movement when they are executed. Here's a breakdown:
Buy Order Block: This occurs when there's a large concentration of buy orders at a specific price level. It indicates a significant interest among traders to purchase the asset if the price reaches that level.
Sell Order Block: Conversely, a sell order block happens when there's a notable accumulation of sell orders at a particular price level. This suggests that many traders are willing to sell the asset if the price reaches that level.
Impact on Price: Order blocks can influence price movement because when the market approaches these levels, the orders within the block may be triggered, leading to increased buying or selling pressure, depending on the type of block. This surge in trading activity can cause the price to either bounce off the level or break through it.
Support and Resistance: Order blocks are often associated with support and resistance levels. A buy order block may act as support, preventing the price from falling further, while a sell order block may serve as resistance, hindering upward price movement.
Fair-Value-Gap
The fair value gap in trading refers to the difference between the current market price of an asset and its calculated fair value. This concept is often used in financial markets, especially in the context of stocks and other securities. Here's a breakdown:
Market Price: The market price is the price at which an asset is currently trading in the market. It is determined by the interaction of supply and demand forces, as well as various other factors such as news, sentiment, and economic conditions.
Fair Value: Fair value represents the estimated intrinsic value of an asset based on fundamental analysis, which includes factors such as earnings, dividends, cash flow, growth prospects, and prevailing interest rates. It's essentially what an asset should be worth based on its fundamentals.
Fair Value Calculation: Analysts and investors use various methods to calculate the fair value of an asset. Common approaches include discounted cash flow (DCF) analysis, comparable company analysis (CCA), and dividend discount models (DDM), among others.
Fair Value Gap: The fair value gap is the numerical difference between the calculated fair value of an asset and its current market price. If the market price is higher than the fair value, it suggests that the asset may be overvalued. Conversely, if the market price is lower than the fair value, it indicates that the asset may be undervalued.
Trading Implications: Traders and investors often pay attention to the fair value gap to identify potential trading opportunities. If the market price deviates significantly from the fair value, it may present opportunities to buy or sell the asset with the expectation that the market price will eventually converge towards its fair value.

ICT Concepts [LuxAlgo]The ICT Concepts indicator regroups core concepts highlighted by trader and educator "The Inner Circle Trader" (ICT) into an all-in-one toolkit. Features include Market Structure (MSS & BOS), Order Blocks, Imbalances, Buyside/Sellside Liquidity, Displacements, ICT Killzones, and New Week/Day Opening Gaps.
🔶 SETTINGS
🔹 Mode
When Present is selected, only data of the latest 500 bars are used/visualized, except for NWOG/NDOG
🔹 Market Structure
Enable/disable Market Structure.
Length: will set the lookback period/sensitivity.
In Present Mode only the latest Market Structure trend will be shown, while in Historical Mode, previous trends will be shown as well:
You can toggle MSS/BOS separately and change the colors:
🔹 Displacement
Enable/disable Displacement.
🔹 Volume Imbalance
Enable/disable Volume Imbalance.
# Visible VI's: sets the amount of visible Volume Imbalances (max 100), color setting is placed at the side.
🔹 Order Blocks
Enable/disable Order Blocks.
Swing Lookback: Lookback period used for the detection of the swing points used to create order blocks.
Show Last Bullish OB: Number of the most recent bullish order/breaker blocks to display on the chart.
Show Last Bearish OB: Number of the most recent bearish order/breaker blocks to display on the chart.
Color settings.
Show Historical Polarity Changes: Allows users to see labels indicating where a swing high/low previously occurred within a breaker block.
Use Candle Body: Allows users to use candle bodies as order block areas instead of the full candle range.
Change in Order Blocks style:
🔹 Liquidity
Enable/disable Liquidity.
Margin: sets the sensitivity, 2 points are fairly equal when:
'point 1' < 'point 2' + (10 bar Average True Range / (10 / margin)) and
'point 1' > 'point 2' - (10 bar Average True Range / (10 / margin))
# Visible Liq. boxes: sets the amount of visible Liquidity boxes (max 50), this amount is for Sellside and Buyside boxes separately.
Colour settings.
Change in Liquidity style:
🔹 Fair Value Gaps
Enable/disable FVG's.
Balance Price Range: this is the overlap of latest bullish and bearish Fair Value Gaps.
By disabling Balance Price Range only FVGs will be shown.
Options: Choose whether you wish to see FVG or Implied Fair Value Gaps (this will impact Balance Price Range as well)
# Visible FVG's: sets the amount of visible FVG's (max 20, in the same direction).
Color settings.
Change in FVG style:
🔹 NWOG/NDOG
Enable/disable NWOG; color settings; amount of NWOG shown (max 50).
Enable/disable NDOG ; color settings; amount of NDOG shown (max 50).
🔹 Fibonacci
This tool connects the 2 most recent bullish/bearish (if applicable) features of your choice, provided they are enabled.
3 examples (FVG, BPR, OB):
Extend lines -> Enabled (example OB):
🔹 Killzones
Enable/disable all or the ones you need.
Time settings are coded in the corresponding time zones.
🔶 USAGE
By default, the indicator displays each feature relevant to the most recent price variations in order to avoid clutter on the chart & to provide a very similar experience to how a user would contruct ICT Concepts by hand.
Users can use the historical mode in the settings to see historical market structure/imbalances. The ICT Concepts indicator has various use cases, below we outline many examples of how a trader could find usage of the features together.
In the above image we can see price took out Sellside liquidity, filled two bearish FVGs, a market structure shift, which then led to a clean retest of a bullish FVG as a clean setup to target the order block above.
Price then fills the OB which creates a breaker level as seen in yellow.
Broken OBs can be useful for a trader using the ICT Concepts indicator as it marks a level where orders have now been filled, indicating a solidified level that has proved itself as an area of liquidity. In the image above we can see a trade setup using a broken bearish OB as a potential entry level.
We can see the New Week Opening Gap (NWOG) above was an optimal level to target considering price may tend to fill / react off of these levels according to ICT.
In the next image above, we have another example of various use cases where the ICT Concepts indicator hypothetically allow traders to find key levels & find optimal entry points using market structure.
In the image above we can see a bearish Market Structure Shift (MSS) is confirmed, indicating a potential trade setup for targeting the Balanced Price Range imbalance (BPR) below with a stop loss above the buyside liquidity.
Although what we are demonstrating here is a hindsight example, it shows the potential usage this toolkit gives you for creating trading plans based on ICT Concepts.
Same chart but playing out the history further we can see directly after price came down to the Sellside liquidity & swept below it...
Then by enabling IFVGs in the settings, we can see the IFVG retests alongside the Sellside & Buyside liquidity acting in confluence.
Which allows us to see a great bullish structure in the market with various key levels for potential entries.
Here we can see a potential bullish setup as price has taken out a previous Sellside liquidity zone and is now retesting a NWOG + Volume Imbalance.
Users also have the option to display Fibonacci retracements based on market structure, order blocks, and imbalance areas, which can help place limit/stop orders more effectively as well as finding optimal points of interest beyond what the primary ICT Concepts features can generate for a trader.
In the above image we can see the Fibonacci extension was selected to be based on the NWOG giving us some upside levels above the buyside liquidity.
🔶 DETAILS
Each feature within the ICT Concepts indicator is described in the sub sections below.
🔹 Market Structure
Market structure labels are constructed from price breaking a prior swing point. This allows a user to determine the current market trend based on the price action.
There are two types of Market Structure labels included:
Market Structure Shift (MSS)
Break Of Structure (BOS)
A MSS occurs when price breaks a swing low in an uptrend or a swing high in a downtrend, highlighting a potential reversal. This is often labeled as "CHoCH", but ICT specifies it as MSS.
On the other hand, BOS labels occur when price breaks a swing high in an uptrend or a swing low in a downtrend. The occurrence of these particular swing points is caused by retracements (inducements) that highlights liquidity hunting in lower timeframes.
🔹 Order Blocks
More significant market participants (institutions) with the ability of placing large orders in the market will generally place a sequence of individual trades spread out in time. This is referred as executing what is called a "meta-order".
Order blocks highlight the area where potential meta-orders are executed. Bullish order blocks are located near local bottoms in an uptrend while bearish order blocks are located near local tops in a downtrend.
When price mitigates (breaks out) an order block, a breaker block is confirmed. We can eventually expect price to trade back to this breaker block offering a new trade opportunity.
🔹 Buyside & Sellside Liquidity
Buyside / Sellside liquidity levels highlight price levels where market participants might place limit/stop orders.
Buyside liquidity levels will regroup the stoploss orders of short traders as well as limit orders of long traders, while Sellside liquidity levels will regroup the stoploss orders of long traders as well as limit orders of short traders.
These levels can play different roles. More informed market participants might view these levels as source of liquidity, and once liquidity over a specific level is reduced it will be found in another area.
🔹 Imbalances
Imbalances highlight disparities between the bid/ask, these can also be defined as inefficiencies, which would suggest that not all available information is reflected by the price and would as such provide potential trading opportunities.
It is common for price to "rebalance" and seek to come back to a previous imbalance area.
ICT highlights multiple imbalance formations:
Fair Value Gaps: A three candle formation where the candle shadows adjacent to the central candle do not overlap, this highlights a gap area.
Implied Fair Value Gaps: Unlike the fair value gap the implied fair value gap has candle shadows adjacent to the central candle overlapping. The gap area is constructed from the average between the respective shadow and the nearest extremity of their candle body.
Balanced Price Range: Balanced price ranges occur when a fair value gap overlaps a previous fair value gap, with the overlapping area resulting in the imbalance area.
Volume Imbalance: Volume imbalances highlight gaps between the opening price and closing price with existing trading activity (the low/high overlap the previous high/low).
Opening Gap: Unlike volume imbalances opening gaps highlight areas with no trading activity. The low/high does not reach previous high/low, highlighting a "void" area.
🔹 Displacement
Displacements are scenarios where price forms successive candles of the same sentiment (bullish/bearish) with large bodies and short shadows.
These can more technically be identified by positive auto correlation (a close to open change is more likely to be followed by a change of the same sign) as well as volatility clustering (large changes are followed by large changes).
Displacements can be the cause for the formation of imbalances as well as market structure, these can be caused by the full execution of a meta order.
🔹 Kill Zones
Killzones represent different time intervals that aims at offering optimal trade entries. Killzones include:
- New York Killzone (7:9 ET)
- London Open Killzone (2:5 ET)
- London Close Killzone (10:12 ET)
- Asian Killzone (20:00 ET)
🔶 Conclusion & Supplementary Material
This script aims to emulate how a trader would draw each of the covered features on their chart in the most precise representation to how it's actually taught by ICT directly.
There are many parallels between ICT Concepts and Smart Money Concepts that we released in 2022 which has a more general & simpler usage:
ICT Concepts, however, is more specifically aligned toward the community's interpretation of how to analyze price 'based on ICT', rather than displaying features to have a more classic interpretation for a technical analyst.

Uptrick: FVG Market Zones**Uptrick: FVG Market Zones**
---
### Introduction
**Uptrick: FVG Market Zones** is a cutting-edge technical analysis tool designed to identify and visualize Fair Value Gaps (FVGs) within financial markets. This indicator focuses on pinpointing critical price levels where significant gaps occur, which can act as potential support and resistance zones. By integrating advanced volatility analysis and user-configurable parameters, the **Uptrick: FVG Market Zones** provides traders with a robust framework for understanding market dynamics and making informed trading decisions.
### Purpose and Functionality
The primary purpose of the **Uptrick: FVG Market Zones** indicator is to detect and highlight Fair Value Gaps, which are areas on a price chart where there is a significant price movement without any trading activity in between. These gaps can provide critical insights into market behavior, as they often indicate areas where the market has not fully accounted for the supply and demand dynamics. Traders use these zones to anticipate potential reversals, breakouts, or consolidations, making this tool highly valuable for both short-term and long-term trading strategies.
### Unique Features and Originality
The **Uptrick: FVG Market Zones** indicator is distinguished by its focus on FVGs and its ability to integrate this concept into a broader market analysis framework. Unlike other indicators that may offer generalized support and resistance levels, this tool specifically identifies and visualizes gaps based on volatility-adjusted criteria. This precision allows traders to focus on the most relevant market zones, improving their ability to anticipate market movements.
One of the standout features of this indicator is its user-configurable settings, which provide a high degree of customization. This flexibility ensures that traders can tailor the indicator to suit their specific trading style and the particular market they are analyzing. Additionally, the indicator's visualization capabilities are enhanced with customizable colors and gap-filling options, making it easier for traders to interpret and act on the information presented.
### Inputs and Configurations
**Uptrick: FVG Market Zones** comes with several user inputs that allow traders to customize the indicator's behavior and appearance. Each input plays a crucial role in determining how the indicator identifies and visualizes FVGs on the chart. Here’s a detailed breakdown of each input:
1. **FVG Analysis Period (fvgPeriod):**
- **Description:** This input determines the period over which the indicator analyzes the chart for identifying FVGs. By adjusting this value, traders can control how far back in time the indicator looks to detect significant gaps.
- **Default Value:** 25
- **Purpose:** A shorter period may focus on more recent market activity, making the indicator more sensitive to recent price movements. In contrast, a longer period allows the indicator to identify gaps that have remained unfilled for an extended time, potentially acting as stronger support or resistance levels.
2. **Analysis Mode (mode):**
- **Description:** The Analysis Mode input allows traders to choose between different methods of analyzing the chart for FVGs.
- **Options:** "Recent Gaps" and "Extended View"
- **Default Option:** "Recent Gaps"
- **Purpose:**
- **Recent Gaps:** Focuses on the latest significant gaps, providing traders with up-to-date information on the most relevant market zones.
- **Extended View:** Considers a broader range of gap patterns, which can be useful in markets where historical gaps may still influence current price action.
3. **Volatility Sensitivity (volatilityFactor):**
- **Description:** This input adjusts the sensitivity of the indicator to market volatility. It is used in calculating the threshold for identifying FVGs.
- **Default Value:** 0.3
- **Step Size:** 0.1
- **Purpose:** A higher sensitivity will cause the indicator to detect smaller gaps, which might be more frequent but less significant. Lower sensitivity focuses on larger, more impactful gaps, which are less frequent but potentially more powerful in predicting market behavior.
4. **Highlight Market Gaps (showGaps):**
- **Description:** A boolean input that determines whether the identified FVGs should be highlighted on the chart.
- **Default Value:** True
- **Purpose:** This input allows traders to toggle the visualization of FVGs. When enabled, the indicator highlights gaps using colored boxes, making them visually prominent on the chart.
5. **Bullish Highlight Color (bullColor):**
- **Description:** Sets the color used to highlight bullish FVGs (gaps that may indicate support).
- **Default Value:** #00FF7F (a shade of green)
- **Purpose:** The color choice is crucial for quickly distinguishing bullish zones from bearish ones. Green is typically associated with upward price movement, making it intuitive for traders to identify potential support areas.
6. **Bearish Highlight Color (bearColor):**
- **Description:** Sets the color used to highlight bearish FVGs (gaps that may indicate resistance).
- **Default Value:** #FF4500 (a shade of red)
- **Purpose:** Red is commonly associated with downward price movement, making it easy for traders to identify potential resistance areas. This color coding helps in quickly assessing the chart.
7. **Fill Gap Areas (fillGaps):**
- **Description:** A boolean input that determines whether the FVGs should be filled with a color on the chart.
- **Default Value:** True
- **Purpose:** Filling the gap areas provides a more solid visual cue for traders. It enhances the visibility of the gaps, making it easier to spot these zones during fast-paced trading sessions.
8. **Hidden Color (hidden):**
- **Description:** A color input that is used when certain elements should be hidden from the chart.
- **Default Value:** color.rgb(0,0,0,100) (a semi-transparent black)
- **Purpose:** This input is useful for controlling the visibility of certain plots or elements on the chart, ensuring that the indicator remains clean and uncluttered.
### Market Gap Detection
The core functionality of the **Uptrick: FVG Market Zones** indicator lies in its ability to detect Fair Value Gaps. These gaps occur when the price makes a significant jump from one level to another without any trading activity in between. The indicator uses a combination of price action analysis and volatility thresholds to identify these gaps.
- **Volatility Measurement:** The indicator begins by measuring market volatility using the Average True Range (ATR). This volatility measurement is then adjusted by the user-defined sensitivity factor, which determines the threshold for identifying significant gaps.
- **Gap Identification:** The indicator checks for instances where the current low is higher than the high two bars ago (bullish gap) or where the current high is lower than the low two bars ago (bearish gap). These conditions signify a potential FVG.
- **Gap Storage and Management:** Once a gap is identified, it is stored in an array. The indicator also manages the size of these arrays based on the selected analysis mode, ensuring that only the most relevant gaps are considered in the analysis.
### Visualization
Visualization is a key component of the **Uptrick: FVG Market Zones** indicator. By providing clear and customizable visual cues, the indicator ensures that traders can quickly and easily interpret the information it provides.
- **Gap Highlighting:** When enabled, the indicator highlights the identified FVGs on the chart using colored boxes. Bullish gaps are highlighted in green, while bearish gaps are highlighted in red. This color coding helps traders instantly recognize potential support and resistance zones.
- **Gap Filling:** The indicator can also fill the identified gaps with a semi-transparent color. This option enhances the visibility of the gaps, making them more prominent on the chart. Filled gaps are particularly useful for traders who want to keep track of these zones over multiple trading sessions.
- **Gap Averages:** The indicator calculates the average level of the identified gaps and plots these averages as lines on the chart. These lines represent the general area of support or resistance based on the detected gaps, providing traders with a reference point for setting their stop losses or profit targets.
- **Text Labels:** The indicator also labels each FVG with the text "FVG" inside the highlighted area. This feature ensures that traders can easily identify these zones even in charts with dense price action.
### Practical Applications
The **Uptrick: FVG Market Zones** indicator is versatile and can be applied to a wide range of trading strategies across different markets and timeframes. Here are a few examples of how this indicator can be used in practice:
1. **Support and Resistance Trading:**
- Traders can use the identified FVGs as dynamic support and resistance levels. By placing their trades based on these levels, they can take advantage of potential reversals or continuations at key market zones.
2. **Gap Filling Strategy:**
- Some traders focus on the concept of gap filling, where the market eventually returns to "fill" the gap created by rapid price movements. The **Uptrick: FVG Market Zones** indicator can
help identify such gaps and anticipate when the market might return to these levels.
3. **Breakout Trading:**
- The indicator can be used to identify breakouts from significant gaps. When the price moves beyond the identified FVGs, it may signal a strong trend continuation, providing an opportunity for breakout traders.
4. **Reversal Trading:**
- By monitoring the signals generated by the indicator, traders can identify potential market reversals. A sell signal after a prolonged uptrend or a buy signal after a downtrend may indicate a reversal, allowing traders to position themselves accordingly.
5. **Risk Management:**
- The average levels of the FVGs can be used to set stop-loss and take-profit levels. By aligning these levels with the FVG zones, traders can improve their risk management practices and enhance their trading discipline.
### Customization and Flexibility
One of the standout features of the **Uptrick: FVG Market Zones** indicator is its high level of customization. Traders can adjust various parameters to tailor the indicator to their specific needs and preferences.
- **Customizable Colors:** The indicator allows traders to choose their preferred colors for highlighting bullish and bearish gaps. This flexibility ensures that the indicator can be integrated seamlessly into any trading setup, regardless of the trader's color scheme preferences.
- **Adjustable Periods and Sensitivity:** By allowing traders to adjust the analysis period and volatility sensitivity, the indicator can be fine-tuned to suit different market conditions. For example, a trader might use a shorter analysis period and higher sensitivity in a volatile market, while opting for a longer period and lower sensitivity in a more stable market.
- **Toggling Visual Elements:** Traders can choose to enable or disable various visual elements of the indicator, such as gap highlighting, gap filling, and text labels. This level of control allows traders to declutter their charts and focus on the information that is most relevant to their trading strategy.
### Advantages and Benefits
The **Uptrick: FVG Market Zones** indicator offers several key advantages that make it a valuable tool for traders:
1. **Precision:** By focusing on Fair Value Gaps, the indicator provides highly precise levels of support and resistance, which are often more reliable than traditional horizontal levels.
2. **Clarity:** The clear visual representation of FVGs, along with the text labels and color coding, ensures that traders can quickly interpret the indicator's signals and incorporate them into their trading decisions.
3. **Adaptability:** The indicator's customizable settings allow it to be adapted to different markets, timeframes, and trading styles. Whether you are a day trader, swing trader, or long-term investor, this indicator can be tailored to meet your needs.
4. **Enhanced Decision-Making:** The trading signals generated by the indicator provide actionable insights that can help traders make more informed decisions. By aligning their trades with the identified FVG zones, traders can improve their chances of success.
5. **Risk Management:** The use of FVG zones as reference points for stop-loss and take-profit levels enhances risk management practices, helping traders protect their capital while maximizing their profit potential.
### Conclusion
The **Uptrick: FVG Market Zones** indicator is a powerful and versatile tool for traders seeking to enhance their market analysis and improve their trading outcomes. By focusing on Fair Value Gaps and providing a high level of customization, this indicator offers a unique blend of precision, clarity, and adaptability. Whether you are looking to identify key market zones, generate trading signals, or improve your risk management practices, the **Uptrick: FVG Market Zones** indicator is a valuable addition to any trader's toolkit.
With its innovative approach to market analysis and user-friendly design, **Uptrick: FVG Market Zones** stands out as an essential tool for traders who want to stay ahead of the market and make more informed trading decisions. Whether you are trading stocks, forex, commodities, or cryptocurrencies, this indicator provides the insights you need to navigate the markets with confidence and success.

CandelaCharts - 1st Presented FVG 📝 Overview
The ICT 1st Presented Fair Value Gap refers to the first FVG that forms after the market opens at 9:30 AM New York local time. In a sideways market, it often acts as a catalyst for price movement in either direction, while in trending conditions, it tends to support and reinforce the prevailing trend.
This indicator automatically identifies the first Fair Value Gap (FVG) that forms after the New York session opens at 9:30 AM local time. Based on concepts taught by Inner Circle Trader (ICT), the 1st Presented FVG is a key institutional price imbalance that often sets the tone for the trading day.
📦 Features
Customize FVG session time (e.g. 09:30 – 10:00)
Show/hide session dividers
FVG visibility filter (e.g. Bullish / Bearish)
Advanced styling
Hide overlapping FVGs
Extend FVGs
Opening prices
⚙️ Settings
Show: Controls whether all, bullish only, or bearish only FVGs are displayed on the chart.
Session: Sets a specific time window (e.g. 09:30–10:00) to filter which FVGs are displayed.
Dividers: Toggles vertical session divider on the chart for visual separation.
Midline: Displays a midpoint (CE) line through the FVG; customizable color and thickness.
Border: Adds a border around each FVG zone.
Labels: Toggles label display for FVGs.
Hide Overlap: Hides overlapping FVGs to reduce visual clutter.
Extend: Extends each FVG forward in time.
Alerts: Enables alerts when price interacts with an FVG zone.
Opening Prices: Allows defining custom time-based levels (e.g. 00:00–00:01 and 18:00–18:01) with color and style options.
⚡️ Showcase
Simple
Labels
Bordered
Consequent Encroachment
Extended
Dividers
📒 Usage
How to Use the ICT 1st Presented Fair Value Gap in Trading
To apply the ICT 1st Presented Fair Value Gap (FVG), identify the first fair value gap of the day and extend it across the chart until 3:45 PM New York time.
You’ll often notice that some of the best trade setups form around this level. It tends to act as a key reference point for price action during the day—especially on trending days, where price frequently returns to this gap before continuing in its direction.
This level can also serve as an inverse fair value gap, offering opportunities in the opposite direction under the right conditions.
How to Disqualify the 1st Presented Fair Value Gap?
When the first fair value gap forms after 9:30 AM New York time, check the candles that came just before it.
If the candlestick that creates the FVG doesn’t break above or below the range of those previous candles, then it’s not a true inefficiency. In that case, it’s considered a disqualified 1st Presented Fair Value Gap—meaning it shouldn’t be used as a key reference level.
Refer to the example below to see what this looks like on the chart.
🚨 Alerts
This script provides alert options for all signals.
Bearish Signal
A bearish signal is triggered when the bearish 1st P.FVG is formed in interval 09:30 - 10:00.
Bullish Signal
A bullish signal is triggered when the bullish 1st P.FVG is formed in interval 09:30 - 10:00.
⚠️ Disclaimer
Trading involves significant risk, and many participants may incur losses. The content on this site is not intended as financial advice and should not be interpreted as such. Decisions to buy, sell, hold, or trade securities, commodities, or other financial instruments carry inherent risks and are best made with guidance from qualified financial professionals. Past performance is not indicative of future results.
